
 Yahoo Finance
 Update: Strix Group (LON:KETL) Stock Gained 25% In The Last Year

If you want to compound wealth in the stock market, you can do so by buying an index fund. But one can do better than that by picking better than average stocks (as part of a diversified portfolio). For example, the Strix Group Plc (LON:KETL) share price is up 25% in the last year, clearly besting the market return of around 4.8% (not including dividends). That's a solid performance by our standards! Note that businesses generally develop over the long term, so the returns over the last year might not reflect a long term trend.
Check out our latest analysis for Strix Group
In his essay The Superinvestors of Graham-and-Doddsville Warren Buffett described how share prices do not always rationally reflect the value of a business. One way to examine how market sentiment has changed over time is to look at the interaction between a company's share price and its earnings per share (EPS).
During the last year, Strix Group actually saw its earnings per share drop 4.4%.
We don't think that the decline in earnings per share is a good measure of the business over the last twelve months. Since the change in EPS doesn't seem to correlate with the change in share price, it's worth taking a look at other metrics.
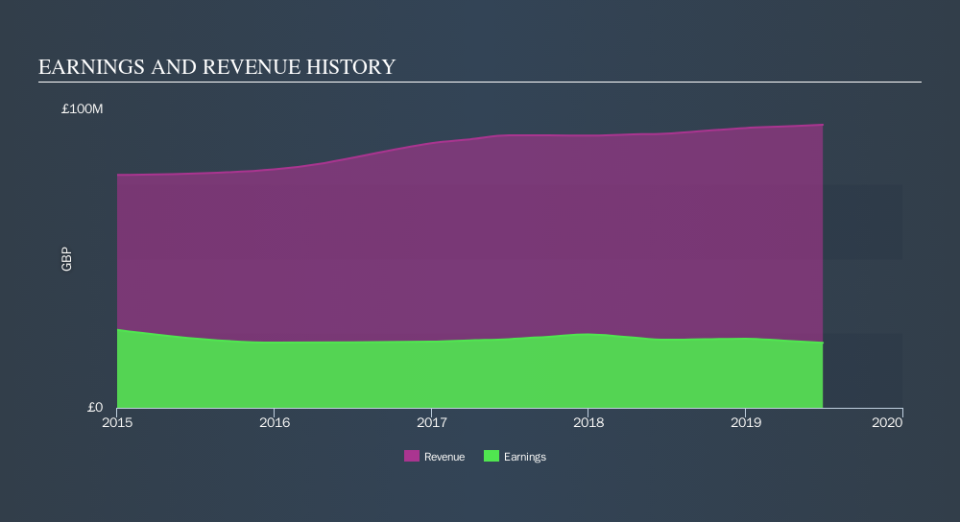
We note that the most recent dividend payment is higher than the payment a year ago, so that may have assisted the share price. Income-seeking investors probably helped bid up the stock price. Though we must add that the revenue growth of 3.2% year on year would have helped paint a pretty picture.
The graphic below depicts how earnings and revenue have changed over time (unveil the exact values by clicking on the image).
If you are thinking of buying or selling Strix Group stock, you should check out this FREE detailed report on its balance sheet.
What About Dividends?
When looking at investment returns, it is important to consider the difference between total shareholder return (TSR) and share price return. Whereas the share price return only reflects the change in the share price, the TSR includes the value of dividends (assuming they were reinvested) and the benefit of any discounted capital raising or spin-off. It's fair to say that the TSR gives a more complete picture for stocks that pay a dividend. We note that for Strix Group the TSR over the last year was 30%, which is better than the share price return mentioned above. And there's no prize for guessing that the dividend payments largely explain the divergence!
A Different Perspective
Strix Group boasts a total shareholder return of 30% for the last year (that includes the dividends) . The more recent returns haven't been as impressive as the longer term returns, coming in at just 4.2%. Having said that, we doubt shareholders would be concerned. It seems the market is simply waiting on more information, because if the business delivers so will the share price (eventually). Importantly, we haven't analysed Strix Group's dividend history. This free visual report on its dividends is a must-read if you're thinking of buying.
Of course, you might find a fantastic investment by looking elsewhere. So take a peek at this free list of companies we expect will grow earnings.
Please note, the market returns quoted in this article reflect the market weighted average returns of stocks that currently trade on GB exchanges.
We aim to bring you long-term focused research analysis driven by fundamental data. Note that our analysis may not factor in the latest price-sensitive company announcements or qualitative material.
If you spot an error that warrants correction, please contact the editor at editorial-team@simplywallst.com. This article by Simply Wall St is general in nature. It does not constitute a recommendation to buy or sell any stock, and does not take account of your objectives, or your financial situation. Simply Wall St has no position in the stocks mentioned. Thank you for reading.
