
 Yahoo Finance
 Should Strix Group Plc (LON:KETL) Be Part Of Your Dividend Portfolio?

Today we'll take a closer look at Strix Group Plc (LON:KETL) from a dividend investor's perspective. Owning a strong business and reinvesting the dividends is widely seen as an attractive way of growing your wealth. Unfortunately, it's common for investors to be enticed in by the seemingly attractive yield, and lose money when the company has to cut its dividend payments.
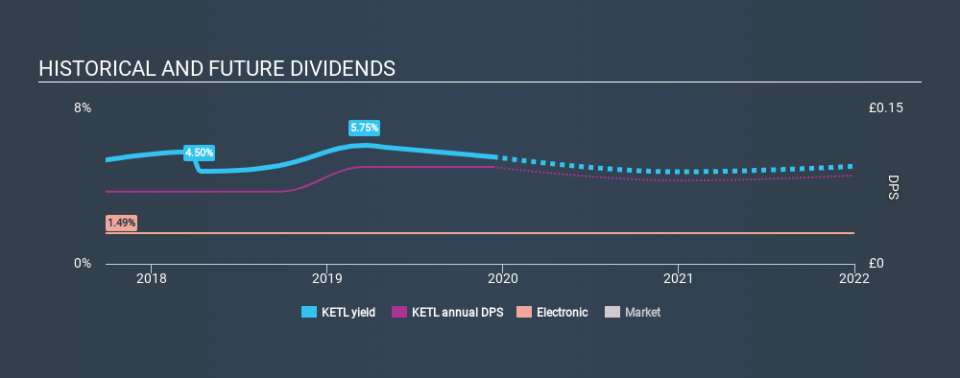
Strix Group yields a solid 5.2%, although it has only been paying for two years. A 5.2% yield does look good. Could the short payment history hint at future dividend growth? During the year, the company also conducted a buyback equivalent to around 1.4% of its market capitalisation. Some simple analysis can offer a lot of insights when buying a company for its dividend, and we'll go through this below.
Explore this interactive chart for our latest analysis on Strix Group!
Payout ratios
Dividends are usually paid out of company earnings. If a company is paying more than it earns, then the dividend might become unsustainable - hardly an ideal situation. So we need to form a view on if a company's dividend is sustainable, relative to its net profit after tax. Looking at the data, we can see that 64% of Strix Group's profits were paid out as dividends in the last 12 months. A payout ratio above 50% generally implies a business is reaching maturity, although it is still possible to reinvest in the business or increase the dividend over time.
We also measure dividends paid against a company's levered free cash flow, to see if enough cash was generated to cover the dividend. Strix Group paid out 67% of its free cash flow last year, which is acceptable, but is starting to limit the amount of earnings that can be reinvested into the business. It's positive to see that Strix Group's dividend is covered by both profits and cash flow, since this is generally a sign that the dividend is sustainable, and a lower payout ratio usually suggests a greater margin of safety before the dividend gets cut.
Consider getting our latest analysis on Strix Group's financial position here.
Dividend Volatility
One of the major risks of relying on dividend income, is the potential for a company to struggle financially and cut its dividend. Not only is your income cut, but the value of your investment declines as well - nasty. The company has been paying a stable dividend for a few years now, but we'd like to see more evidence of consistency over a longer period. During the past two-year period, the first annual payment was UK£0.07 in 2017, compared to UK£0.094 last year. Dividends per share have grown at approximately 16% per year over this time.
Strix Group has been growing its dividend quite rapidly, which is exciting. However, the short payment history makes us question whether this performance will persist across a full market cycle.
Dividend Growth Potential
While dividend payments have been relatively reliable, it would also be nice if earnings per share (EPS) were growing, as this is essential to maintaining the dividend's purchasing power over the long term. EPS have fallen -4.4% over the last 12 months. While this is not ideal, one year is a short time in business, and we wouldn't want to get too hung up on this. We do note though, one year is too short a time to be drawing strong conclusions about a company's future prospects.
Conclusion
To summarise, shareholders should always check that Strix Group's dividends are affordable, that its dividend payments are relatively stable, and that it has decent prospects for growing its earnings and dividend. First, we think Strix Group is paying out an acceptable percentage of its cashflow and profit. Second, earnings per share have been in decline, and the dividend history is shorter than we'd like. In summary, Strix Group has a number of shortcomings that we'd find it hard to get past. Things could change, but we think there are a number of better ideas out there.
Given that earnings are not growing, the dividend does not look nearly so attractive. Very few businesses see earnings consistently shrink year after year in perpetuity though, and so it might be worth seeing what the 5 analysts we track are forecasting for the future.
We have also put together a list of global stocks with a market capitalisation above $1bn and yielding more 3%.
If you spot an error that warrants correction, please contact the editor at editorial-team@simplywallst.com. This article by Simply Wall St is general in nature. It does not constitute a recommendation to buy or sell any stock, and does not take account of your objectives, or your financial situation. Simply Wall St has no position in the stocks mentioned.
We aim to bring you long-term focused research analysis driven by fundamental data. Note that our analysis may not factor in the latest price-sensitive company announcements or qualitative material. Thank you for reading.
