
 Yahoo Finance
 Are Strong Financial Prospects The Force That Is Driving The Momentum In Fugro N.V.'s AMS:FUR) Stock?
Fugro (AMS:FUR) has had a great run on the share market with its stock up by a significant 26% over the last three months. Given that the market rewards strong financials in the long-term, we wonder if that is the case in this instance. In this article, we decided to focus on Fugro's ROE.
Return on equity or ROE is an important factor to be considered by a shareholder because it tells them how effectively their capital is being reinvested. Simply put, it is used to assess the profitability of a company in relation to its equity capital.
View our latest analysis for Fugro
How Is ROE Calculated?
The formula for ROE is:
Return on Equity = Net Profit (from continuing operations) ÷ Shareholders' Equity
So, based on the above formula, the ROE for Fugro is:
20% = €257m ÷ €1.3b (Based on the trailing twelve months to December 2023).
The 'return' is the profit over the last twelve months. That means that for every €1 worth of shareholders' equity, the company generated €0.20 in profit.
What Is The Relationship Between ROE And Earnings Growth?
We have already established that ROE serves as an efficient profit-generating gauge for a company's future earnings. Depending on how much of these profits the company reinvests or "retains", and how effectively it does so, we are then able to assess a company’s earnings growth potential. Assuming everything else remains unchanged, the higher the ROE and profit retention, the higher the growth rate of a company compared to companies that don't necessarily bear these characteristics.
A Side By Side comparison of Fugro's Earnings Growth And 20% ROE
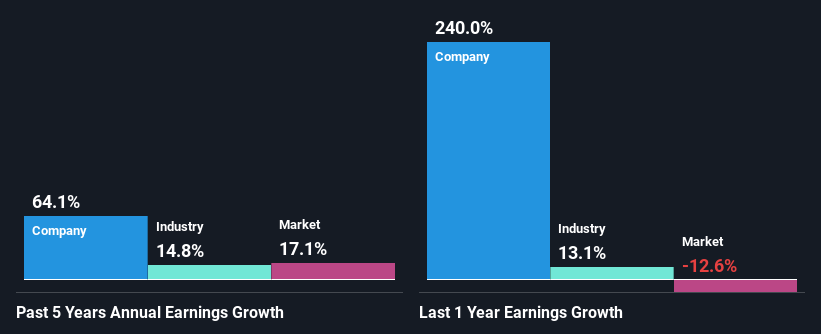
To start with, Fugro's ROE looks acceptable. Especially when compared to the industry average of 15% the company's ROE looks pretty impressive. This probably laid the ground for Fugro's significant 64% net income growth seen over the past five years. However, there could also be other causes behind this growth. For example, it is possible that the company's management has made some good strategic decisions, or that the company has a low payout ratio.
We then compared Fugro's net income growth with the industry and we're pleased to see that the company's growth figure is higher when compared with the industry which has a growth rate of 15% in the same 5-year period.
Earnings growth is a huge factor in stock valuation. What investors need to determine next is if the expected earnings growth, or the lack of it, is already built into the share price. This then helps them determine if the stock is placed for a bright or bleak future. What is FUR worth today? The intrinsic value infographic in our free research report helps visualize whether FUR is currently mispriced by the market.
Is Fugro Using Its Retained Earnings Effectively?
Fugro doesn't pay any dividend to its shareholders, meaning that the company has been reinvesting all of its profits into the business. This is likely what's driving the high earnings growth number discussed above.
Summary
In total, we are pretty happy with Fugro's performance. Particularly, we like that the company is reinvesting heavily into its business, and at a high rate of return. Unsurprisingly, this has led to an impressive earnings growth. Having said that, the company's earnings growth is expected to slow down, as forecasted in the current analyst estimates. To know more about the latest analysts predictions for the company, check out this visualization of analyst forecasts for the company.
Have feedback on this article? Concerned about the content? Get in touch with us directly. Alternatively, email editorial-team (at) simplywallst.com.
This article by Simply Wall St is general in nature. We provide commentary based on historical data and analyst forecasts only using an unbiased methodology and our articles are not intended to be financial advice. It does not constitute a recommendation to buy or sell any stock, and does not take account of your objectives, or your financial situation. We aim to bring you long-term focused analysis driven by fundamental data. Note that our analysis may not factor in the latest price-sensitive company announcements or qualitative material. Simply Wall St has no position in any stocks mentioned.
