
 Yahoo Finance
 Are Strong Financial Prospects The Force That Is Driving The Momentum In Momo Inc.'s NASDAQ:MOMO) Stock?
Momo (NASDAQ:MOMO) has had a great run on the share market with its stock up by a significant 24% over the last three months. Since the market usually pay for a company’s long-term fundamentals, we decided to study the company’s key performance indicators to see if they could be influencing the market. In this article, we decided to focus on Momo's ROE.
Return on Equity or ROE is a test of how effectively a company is growing its value and managing investors’ money. In short, ROE shows the profit each dollar generates with respect to its shareholder investments.
See our latest analysis for Momo
How To Calculate Return On Equity?
Return on equity can be calculated by using the formula:
Return on Equity = Net Profit (from continuing operations) ÷ Shareholders' Equity
So, based on the above formula, the ROE for Momo is:
17% = CN¥2.5b ÷ CN¥14b (Based on the trailing twelve months to September 2020).
The 'return' is the amount earned after tax over the last twelve months. Another way to think of that is that for every $1 worth of equity, the company was able to earn $0.17 in profit.
What Has ROE Got To Do With Earnings Growth?
Thus far, we have learned that ROE measures how efficiently a company is generating its profits. Depending on how much of these profits the company reinvests or "retains", and how effectively it does so, we are then able to assess a company’s earnings growth potential. Assuming everything else remains unchanged, the higher the ROE and profit retention, the higher the growth rate of a company compared to companies that don't necessarily bear these characteristics.
Momo's Earnings Growth And 17% ROE
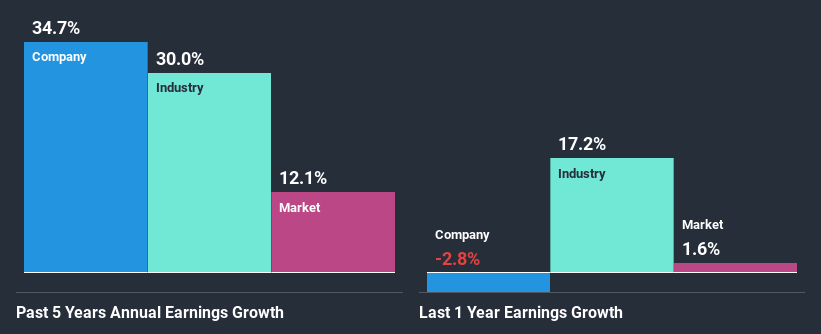
To start with, Momo's ROE looks acceptable. Especially when compared to the industry average of 14% the company's ROE looks pretty impressive. This probably laid the ground for Momo's significant 35% net income growth seen over the past five years. We believe that there might also be other aspects that are positively influencing the company's earnings growth. For example, it is possible that the company's management has made some good strategic decisions, or that the company has a low payout ratio.
As a next step, we compared Momo's net income growth with the industry and found that the company has a similar growth figure when compared with the industry average growth rate of 30% in the same period.
Earnings growth is an important metric to consider when valuing a stock. What investors need to determine next is if the expected earnings growth, or the lack of it, is already built into the share price. This then helps them determine if the stock is placed for a bright or bleak future. Has the market priced in the future outlook for MOMO? You can find out in our latest intrinsic value infographic research report.
Is Momo Efficiently Re-investing Its Profits?
Conclusion
Overall, we are quite pleased with Momo's performance. Specifically, we like that the company is reinvesting a huge chunk of its profits at a high rate of return. This of course has caused the company to see substantial growth in its earnings. Having said that, the company's earnings growth is expected to slow down, as forecasted in the current analyst estimates. To know more about the latest analysts predictions for the company, check out this visualization of analyst forecasts for the company.
This article by Simply Wall St is general in nature. It does not constitute a recommendation to buy or sell any stock, and does not take account of your objectives, or your financial situation. We aim to bring you long-term focused analysis driven by fundamental data. Note that our analysis may not factor in the latest price-sensitive company announcements or qualitative material. Simply Wall St has no position in any stocks mentioned.
Have feedback on this article? Concerned about the content? Get in touch with us directly. Alternatively, email editorial-team (at) simplywallst.com.
