
 Yahoo Finance
 Are Strong Financial Prospects The Force That Is Driving The Momentum In SDI Group plc's LON:SDI) Stock?

SDI Group's (LON:SDI) stock is up by a considerable 11% over the past month. Given that the market rewards strong financials in the long-term, we wonder if that is the case in this instance. Specifically, we decided to study SDI Group's ROE in this article.
Return on Equity or ROE is a test of how effectively a company is growing its value and managing investors’ money. Put another way, it reveals the company's success at turning shareholder investments into profits.
Check out our latest analysis for SDI Group
How To Calculate Return On Equity?
The formula for return on equity is:
Return on Equity = Net Profit (from continuing operations) ÷ Shareholders' Equity
So, based on the above formula, the ROE for SDI Group is:
13% = UK£2.6m ÷ UK£20m (Based on the trailing twelve months to April 2020).
The 'return' is the profit over the last twelve months. Another way to think of that is that for every £1 worth of equity, the company was able to earn £0.13 in profit.
What Is The Relationship Between ROE And Earnings Growth?
We have already established that ROE serves as an efficient profit-generating gauge for a company's future earnings. Based on how much of its profits the company chooses to reinvest or "retain", we are then able to evaluate a company's future ability to generate profits. Assuming all else is equal, companies that have both a higher return on equity and higher profit retention are usually the ones that have a higher growth rate when compared to companies that don't have the same features.
A Side By Side comparison of SDI Group's Earnings Growth And 13% ROE
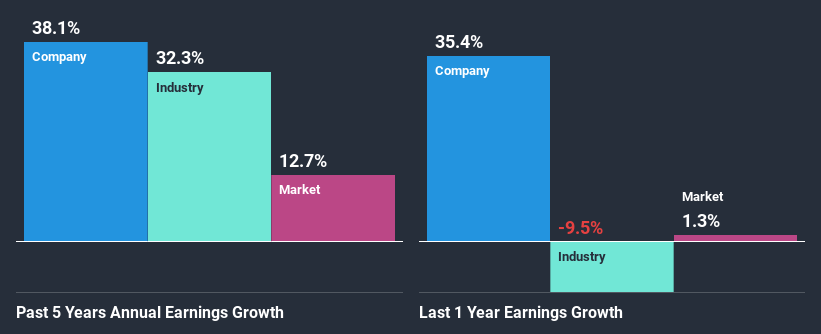
To begin with, SDI Group seems to have a respectable ROE. Especially when compared to the industry average of 9.9% the company's ROE looks pretty impressive. Probably as a result of this, SDI Group was able to see an impressive net income growth of 38% over the last five years. We reckon that there could also be other factors at play here. Such as - high earnings retention or an efficient management in place.
We then performed a comparison between SDI Group's net income growth with the industry, which revealed that the company's growth is similar to the average industry growth of 32% in the same period.
Earnings growth is an important metric to consider when valuing a stock. The investor should try to establish if the expected growth or decline in earnings, whichever the case may be, is priced in. This then helps them determine if the stock is placed for a bright or bleak future. If you're wondering about SDI Group's's valuation, check out this gauge of its price-to-earnings ratio, as compared to its industry.
Is SDI Group Efficiently Re-investing Its Profits?
SDI Group doesn't pay any dividend to its shareholders, meaning that the company has been reinvesting all of its profits into the business. This is likely what's driving the high earnings growth number discussed above.
Summary
On the whole, we feel that SDI Group's performance has been quite good. In particular, it's great to see that the company is investing heavily into its business and along with a high rate of return, that has resulted in a sizeable growth in its earnings. Having said that, the company's earnings growth is expected to slow down, as forecasted in the current analyst estimates. To know more about the latest analysts predictions for the company, check out this visualization of analyst forecasts for the company.
This article by Simply Wall St is general in nature. It does not constitute a recommendation to buy or sell any stock, and does not take account of your objectives, or your financial situation. We aim to bring you long-term focused analysis driven by fundamental data. Note that our analysis may not factor in the latest price-sensitive company announcements or qualitative material. Simply Wall St has no position in any stocks mentioned.
Have feedback on this article? Concerned about the content? Get in touch with us directly. Alternatively, email editorial-team@simplywallst.com.
