
 Yahoo Finance
 Are Strong Financial Prospects The Force That Is Driving The Momentum In Thor Industries, Inc.'s NYSE:THO) Stock?
Most readers would already be aware that Thor Industries' (NYSE:THO) stock increased significantly by 12% over the past three months. Given the company's impressive performance, we decided to study its financial indicators more closely as a company's financial health over the long-term usually dictates market outcomes. In this article, we decided to focus on Thor Industries' ROE.
Return on equity or ROE is an important factor to be considered by a shareholder because it tells them how effectively their capital is being reinvested. Simply put, it is used to assess the profitability of a company in relation to its equity capital.
Check out our latest analysis for Thor Industries
How Is ROE Calculated?
Return on equity can be calculated by using the formula:
Return on Equity = Net Profit (from continuing operations) ÷ Shareholders' Equity
So, based on the above formula, the ROE for Thor Industries is:
22% = US$661m ÷ US$2.9b (Based on the trailing twelve months to July 2021).
The 'return' is the income the business earned over the last year. That means that for every $1 worth of shareholders' equity, the company generated $0.22 in profit.
What Has ROE Got To Do With Earnings Growth?
Thus far, we have learned that ROE measures how efficiently a company is generating its profits. Depending on how much of these profits the company reinvests or "retains", and how effectively it does so, we are then able to assess a company’s earnings growth potential. Generally speaking, other things being equal, firms with a high return on equity and profit retention, have a higher growth rate than firms that don’t share these attributes.
Thor Industries' Earnings Growth And 22% ROE
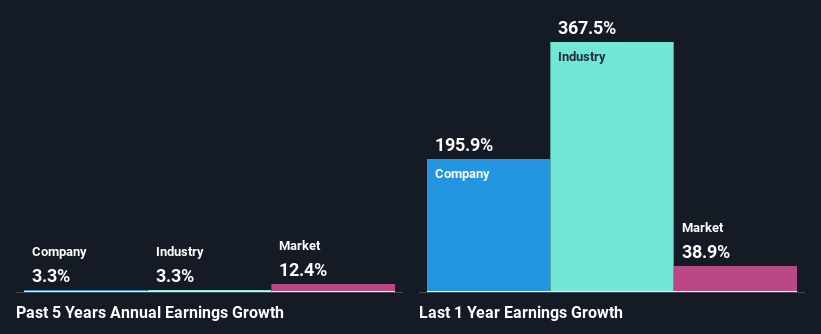
First thing first, we like that Thor Industries has an impressive ROE. Even when compared to the industry average of 22% the company's ROE is pretty decent. However, for some reason, the higher returns aren't reflected in Thor Industries' meagre five year net income growth average of 3.3%.Despite this, Thor Industries' five year net income growth was quite low averaging at only 3.3%.Yet, Thor Industries has posted measly growth of 3.3% over the past five years. This is interesting as the high returns should mean that the company has the ability to generate high growth but for some reason, it hasn't been able to do so. A few likely reasons why this could happen is that the company could have a high payout ratio the business has allocated capital poorly, for instance.
Next, on comparing Thor Industries' net income growth with the industry, we found that the company's reported growth is similar to the industry average growth rate of 3.3% in the same period.
The basis for attaching value to a company is, to a great extent, tied to its earnings growth. What investors need to determine next is if the expected earnings growth, or the lack of it, is already built into the share price. Doing so will help them establish if the stock's future looks promising or ominous. One good indicator of expected earnings growth is the P/E ratio which determines the price the market is willing to pay for a stock based on its earnings prospects. So, you may want to check if Thor Industries is trading on a high P/E or a low P/E, relative to its industry.
Is Thor Industries Efficiently Re-investing Its Profits?
Despite having a moderate three-year median payout ratio of 35% (implying that the company retains the remaining 65% of its income), Thor Industries' earnings growth was quite low. So there could be some other explanation in that regard. For instance, the company's business may be deteriorating.
Additionally, Thor Industries has paid dividends over a period of at least ten years, which means that the company's management is determined to pay dividends even if it means little to no earnings growth. Upon studying the latest analysts' consensus data, we found that the company's future payout ratio is expected to drop to 14% over the next three years. Still forecasts suggest that Thor Industries' future ROE will drop to 17% even though the the company's payout ratio is expected to decrease. This suggests that there could be other factors could driving the anticipated decline in the company's ROE.
Conclusion
In total, we are pretty happy with Thor Industries' performance. Particularly, we like that the company is reinvesting heavily into its business, and at a high rate of return. As a result, the decent growth in its earnings is not surprising. With that said, the latest industry analyst forecasts reveal that the company's earnings are expected to accelerate. To know more about the latest analysts predictions for the company, check out this visualization of analyst forecasts for the company.
This article by Simply Wall St is general in nature. We provide commentary based on historical data and analyst forecasts only using an unbiased methodology and our articles are not intended to be financial advice. It does not constitute a recommendation to buy or sell any stock, and does not take account of your objectives, or your financial situation. We aim to bring you long-term focused analysis driven by fundamental data. Note that our analysis may not factor in the latest price-sensitive company announcements or qualitative material. Simply Wall St has no position in any stocks mentioned.
Have feedback on this article? Concerned about the content? Get in touch with us directly. Alternatively, email editorial-team (at) simplywallst.com.
