
 Yahoo Finance
 Strong week for boohoo group (LON:BOO) shareholders doesn't alleviate pain of one-year loss
Even the best investor on earth makes unsuccessful investments. But it should be a priority to avoid stomach churning catastrophes, wherever possible. So spare a thought for the long term shareholders of boohoo group plc (LON:BOO); the share price is down a whopping 81% in the last twelve months. A loss like this is a stark reminder that portfolio diversification is important. We note that it has not been easy for shareholders over three years, either; the share price is down 72% in that time. Furthermore, it's down 32% in about a quarter. That's not much fun for holders. We really feel for shareholders in this scenario. It's a good reminder of the importance of diversification, and it's worth keeping in mind there's more to life than money, anyway.
Although the past week has been more reassuring for shareholders, they're still in the red over the last year, so let's see if the underlying business has been responsible for the decline.
See our latest analysis for boohoo group
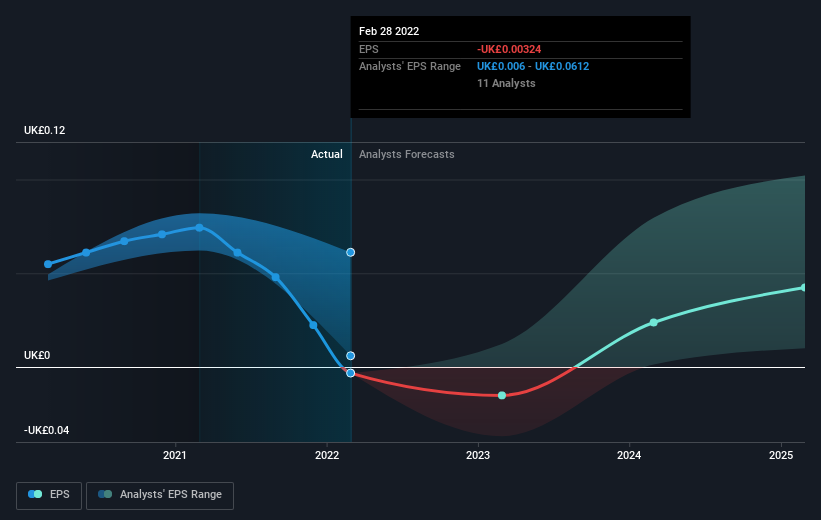
There is no denying that markets are sometimes efficient, but prices do not always reflect underlying business performance. One flawed but reasonable way to assess how sentiment around a company has changed is to compare the earnings per share (EPS) with the share price.
boohoo group fell to a loss making position during the year. Buyers no doubt think it's a temporary situation, but those with a nose for quality have low tolerance for losses. We hope for shareholders' sake that the company becomes profitable again soon.
You can see below how EPS has changed over time (discover the exact values by clicking on the image).
This free interactive report on boohoo group's earnings, revenue and cash flow is a great place to start, if you want to investigate the stock further.
A Different Perspective
While the broader market lost about 5.5% in the twelve months, boohoo group shareholders did even worse, losing 81%. However, it could simply be that the share price has been impacted by broader market jitters. It might be worth keeping an eye on the fundamentals, in case there's a good opportunity. Regrettably, last year's performance caps off a bad run, with the shareholders facing a total loss of 12% per year over five years. Generally speaking long term share price weakness can be a bad sign, though contrarian investors might want to research the stock in hope of a turnaround. It's always interesting to track share price performance over the longer term. But to understand boohoo group better, we need to consider many other factors. For instance, we've identified 1 warning sign for boohoo group that you should be aware of.
Of course boohoo group may not be the best stock to buy. So you may wish to see this free collection of growth stocks.
Please note, the market returns quoted in this article reflect the market weighted average returns of stocks that currently trade on GB exchanges.
Have feedback on this article? Concerned about the content? Get in touch with us directly. Alternatively, email editorial-team (at) simplywallst.com.
This article by Simply Wall St is general in nature. We provide commentary based on historical data and analyst forecasts only using an unbiased methodology and our articles are not intended to be financial advice. It does not constitute a recommendation to buy or sell any stock, and does not take account of your objectives, or your financial situation. We aim to bring you long-term focused analysis driven by fundamental data. Note that our analysis may not factor in the latest price-sensitive company announcements or qualitative material. Simply Wall St has no position in any stocks mentioned.
Join A Paid User Research Session
You’ll receive a US$30 Amazon Gift card for 1 hour of your time while helping us build better investing tools for the individual investors like yourself. Sign up here
