
 Yahoo Finance
 Subdued Growth No Barrier To Voltabox AG's (FRA:VBX) Price
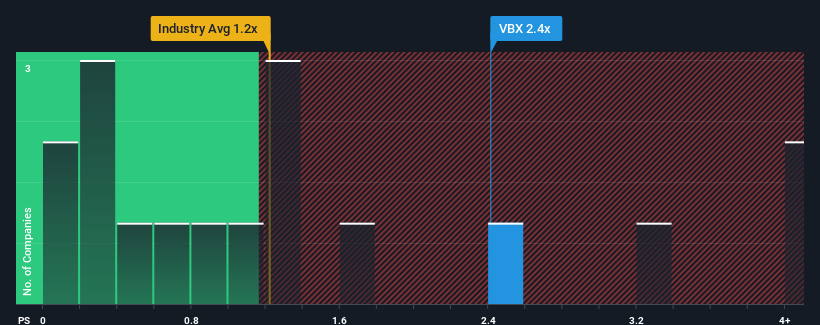
Voltabox AG's (FRA:VBX) price-to-sales (or "P/S") ratio of 2.4x may not look like an appealing investment opportunity when you consider close to half the companies in the Electrical industry in Germany have P/S ratios below 1.2x. However, the P/S might be high for a reason and it requires further investigation to determine if it's justified.
Check out our latest analysis for Voltabox
What Does Voltabox's P/S Mean For Shareholders?
Recent times have been quite advantageous for Voltabox as its revenue has been rising very briskly. Perhaps the market is expecting future revenue performance to outperform the wider market, which has seemingly got people interested in the stock. If not, then existing shareholders might be a little nervous about the viability of the share price.
Although there are no analyst estimates available for Voltabox, take a look at this free data-rich visualisation to see how the company stacks up on earnings, revenue and cash flow.
How Is Voltabox's Revenue Growth Trending?
In order to justify its P/S ratio, Voltabox would need to produce impressive growth in excess of the industry.
If we review the last year of revenue growth, we see the company's revenues grew exponentially. However, this wasn't enough as the latest three year period has seen the company endure a nasty 71% drop in revenue in aggregate. Accordingly, shareholders would have felt downbeat about the medium-term rates of revenue growth.
Comparing that to the industry, which is predicted to deliver 12% growth in the next 12 months, the company's downward momentum based on recent medium-term revenue results is a sobering picture.
With this in mind, we find it worrying that Voltabox's P/S exceeds that of its industry peers. It seems most investors are ignoring the recent poor growth rate and are hoping for a turnaround in the company's business prospects. There's a very good chance existing shareholders are setting themselves up for future disappointment if the P/S falls to levels more in line with the recent negative growth rates.
What We Can Learn From Voltabox's P/S?
Using the price-to-sales ratio alone to determine if you should sell your stock isn't sensible, however it can be a practical guide to the company's future prospects.
We've established that Voltabox currently trades on a much higher than expected P/S since its recent revenues have been in decline over the medium-term. With a revenue decline on investors' minds, the likelihood of a souring sentiment is quite high which could send the P/S back in line with what we'd expect. Unless the the circumstances surrounding the recent medium-term improve, it wouldn't be wrong to expect a a difficult period ahead for the company's shareholders.
You should always think about risks. Case in point, we've spotted 4 warning signs for Voltabox you should be aware of, and 1 of them is significant.
It's important to make sure you look for a great company, not just the first idea you come across. So if growing profitability aligns with your idea of a great company, take a peek at this free list of interesting companies with strong recent earnings growth (and a low P/E).
Have feedback on this article? Concerned about the content? Get in touch with us directly. Alternatively, email editorial-team (at) simplywallst.com.
This article by Simply Wall St is general in nature. We provide commentary based on historical data and analyst forecasts only using an unbiased methodology and our articles are not intended to be financial advice. It does not constitute a recommendation to buy or sell any stock, and does not take account of your objectives, or your financial situation. We aim to bring you long-term focused analysis driven by fundamental data. Note that our analysis may not factor in the latest price-sensitive company announcements or qualitative material. Simply Wall St has no position in any stocks mentioned.
