
 Yahoo Finance
 Suncor Energy (SU) Down 4.6% Since Earnings Report: Can It Rebound?

A month has gone by since the last earnings report for Suncor Energy Inc. SU. Shares have lost about 4.6% in that time frame.
Will the recent negative trend continue leading up to its next earnings release, or is SU due for a breakout? Before we dive into how investors and analysts have reacted as of late, let's take a quick look at its most recent earnings report in order to get a better handle on the important catalysts.
Fourth-Quarter 2017 Results
Suncor Energy reported fourth-quarter 2017 operating earnings per share of 62 cents, surpassing the Zacks Consensus Estimate of 55 cents. Strong refined product sales, reduced total expenses and higher crude price realizations drove the company’s earnings. In the year-ago quarter, the company posted earnings of 29 cents a share.
Quarterly operating earnings came in at C$1,310 million compared with C$636 million in the year-ago quarter, reflecting an increase of 106%. Meanwhile, quarterly revenues of C$3,941 million increased from C$3,352 million in the year-ago quarter.
Production
Total upstream production in the reported quarter was 736,400 barrels of oil equivalent per day (BOE/d), which decreased marginally from the prior-year level of 738,500 BOE/d. The decline in production was due to a drop in output from the Syncrude operations and the Exploration and Production segment.
Oil Sands operations volume was 446,800 barrels per day (Bbl/d) compared with 433,400 Bbl/d in the year-ago quarter. The increase can be attributed to improved mining and extraction reliability and record Firebag production, partially offset by the lower production at MacKay River.
Production from Syncrude operations was 174,400 Bbl/d compared with 187,000 Bbl/d in the year-ago quarter. The decrease was due to the lower upgrader reliability. In the quarter under review, the Syncrude upgrader reliability was 94% lower than year-ago quarter’s 102%.
Suncor’s Exploration and Production segment (consisting of International and Offshore and Natural Gas segments) produced 115,200 BOE/d compared with 118,100 BOE/d in the prior-year quarter. Lower offshore production drove the company’s results, partially offset by the increased output in Libya.
Notably, Suncor’s newly commissioned Hebron asset started production in this quarter, ahead of its schedule.
Also, refinery utilization came in at 94% compared with 93% in the year-ago quarter.
Product Sales
The company’s refined product sales of 526,800 Bbl/d increased from the prior-year quarter level of 514,800 Bbl/d owing to strong reliability at most of Suncor’s refineries. It was partially offset by the impact of Montreal refinery’s third-party power outage.
Expenses
Total expenses in the reported quarter declined to C$7,156 million from C$7,415 million in the year-ago quarter. The company’s financing expenses decreased C$225 million compared with C$532 million incurred in the year-ago quarter. Lower exploration, depreciation and transportation expenses also lowered expenses. The results were partly offset by increased costs related to purchase of crude oil and products.
Balance Sheet & Capital Expenditures
As of Dec 31, 2017, Suncor had cash and cash equivalents of C$2,672 million and total long-term debt of C$13,372 million. The total debt-to-capitalization ratio was approximately 25.6%. The company incurred capital expenditures of C$1,444 million in the quarter under review.
Dividend and Share Repurchase
Suncor returned C$526 million to shareholders through dividends and bought back C$835 million of outstanding shares in fourth-quarter 2017.
Dividend Hike
The company’s board members have approved a 12.5% hike in its quarterly dividend. Suncor will now reward shareholders with a dividend of 36 cents per share. This translates to an annualized dividend of $1.44 per share. The increased dividend will be paid on Mar 26, 2018 to shareholders of record as of Mar 5.
Guidance
The full-year outlook range for E&P production is envisioned to lie within 105,000-115,000 Boe/d. The same for Syncrude production is projected between 150,000 Bbls/d and165,000 Bbls/d. Furthermore, the full-year outlook range for Syncrude cash operating costs anticipated to lie in the $32.50-$35.50/bbl band.
For 2018, the estimated capex came in at $4.5-$5 billion.
How Have Estimates Been Moving Since Then?
In the past month, investors have witnessed an upward trend in fresh estimates. There have been three revisions higher for the current quarter compared to one lower. In the past month, the consensus estimate has shifted by 59.8% due to these changes.
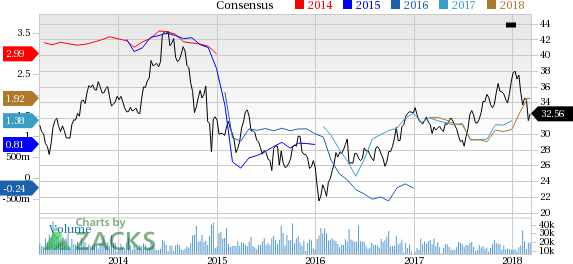
Suncor Energy Inc. Price and Consensus
Suncor Energy Inc. Price and Consensus | Suncor Energy Inc. Quote
VGM Scores
At this time, SU has a nice Growth Score of B, however its Momentum is doing a bit better with an A. However, the stock was allocated a grade of D on the value side, putting it in the bottom 40% for this investment strategy.
Overall, the stock has an aggregate VGM Score of B. If you aren't focused on one strategy, this score is the one you should be interested in.
Our style scores indicate that the stock is more suitable for momentum investors than growth investors.
Outlook
Estimates have been broadly trending upward for the stock and the magnitude of these revisions looks promising. Notably, SU has a Zacks Rank #3 (Hold). We expect an in-line return from the stock in the next few months.
Want the latest recommendations from Zacks Investment Research? Today, you can download 7 Best Stocks for the Next 30 Days. Click to get this free report
Suncor Energy Inc. (SU) : Free Stock Analysis Report
To read this article on Zacks.com click here.
Zacks Investment Research
