
 Yahoo Finance
 Sunlands Technology Group (NYSE:STG) Shareholders Will Want The ROCE Trajectory To Continue
To find a multi-bagger stock, what are the underlying trends we should look for in a business? Firstly, we'll want to see a proven return on capital employed (ROCE) that is increasing, and secondly, an expanding base of capital employed. If you see this, it typically means it's a company with a great business model and plenty of profitable reinvestment opportunities. So when we looked at Sunlands Technology Group (NYSE:STG) and its trend of ROCE, we really liked what we saw.
Understanding Return On Capital Employed (ROCE)
If you haven't worked with ROCE before, it measures the 'return' (pre-tax profit) a company generates from capital employed in its business. To calculate this metric for Sunlands Technology Group, this is the formula:
Return on Capital Employed = Earnings Before Interest and Tax (EBIT) ÷ (Total Assets - Current Liabilities)
0.17 = CN¥114m ÷ (CN¥2.6b - CN¥1.9b) (Based on the trailing twelve months to December 2021).
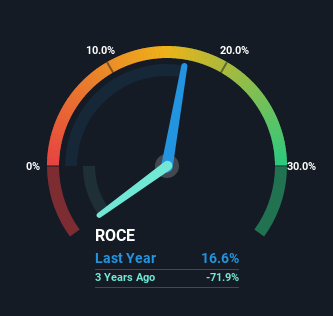
So, Sunlands Technology Group has an ROCE of 17%. On its own, that's a standard return, however it's much better than the 6.4% generated by the Consumer Services industry.
View our latest analysis for Sunlands Technology Group
While the past is not representative of the future, it can be helpful to know how a company has performed historically, which is why we have this chart above. If you'd like to look at how Sunlands Technology Group has performed in the past in other metrics, you can view this free graph of past earnings, revenue and cash flow.
So How Is Sunlands Technology Group's ROCE Trending?
We're delighted to see that Sunlands Technology Group is reaping rewards from its investments and is now generating some pre-tax profits. The company was generating losses four years ago, but now it's earning 17% which is a sight for sore eyes. And unsurprisingly, like most companies trying to break into the black, Sunlands Technology Group is utilizing 281% more capital than it was four years ago. This can indicate that there's plenty of opportunities to invest capital internally and at ever higher rates, both common traits of a multi-bagger.
One more thing to note, Sunlands Technology Group has decreased current liabilities to 74% of total assets over this period, which effectively reduces the amount of funding from suppliers or short-term creditors. So this improvement in ROCE has come from the business' underlying economics, which is great to see. Nevertheless, there are some potential risks the company is bearing with current liabilities that high, so just keep that in mind.
In Conclusion...
Overall, Sunlands Technology Group gets a big tick from us thanks in most part to the fact that it is now profitable and is reinvesting in its business. And since the stock has dived 90% over the last three years, there may be other factors affecting the company's prospects. Still, it's worth doing some further research to see if the trends will continue into the future.
If you want to know some of the risks facing Sunlands Technology Group we've found 5 warning signs (2 are significant!) that you should be aware of before investing here.
For those who like to invest in solid companies, check out this free list of companies with solid balance sheets and high returns on equity.
Have feedback on this article? Concerned about the content? Get in touch with us directly. Alternatively, email editorial-team (at) simplywallst.com.
This article by Simply Wall St is general in nature. We provide commentary based on historical data and analyst forecasts only using an unbiased methodology and our articles are not intended to be financial advice. It does not constitute a recommendation to buy or sell any stock, and does not take account of your objectives, or your financial situation. We aim to bring you long-term focused analysis driven by fundamental data. Note that our analysis may not factor in the latest price-sensitive company announcements or qualitative material. Simply Wall St has no position in any stocks mentioned.
