
 Yahoo Finance
 Can the Sunshine for Retail Stocks Continue?


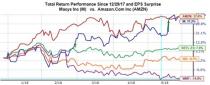
The chart below shows the year-to-date performance of a number of major Retail sector operators – Amazon (AMZN), Macy’s (M), Wal-Mart (WMT) and Home Depot (HD) – and the sector as a whole. To keep the chart from becoming too unwieldy and ‘busy’, I kept the S&P 500 index out of it.
For reference, the large-cap index is up +2.7% in the year-to-date period, lagging the Retail Sector’s +7.9% gain.
As you can see in this chart, the Retail sector has done better than the S&P 500 index, with Macy’s and Amazon really standing out and Wal-Mart the weakest of the four stocks.
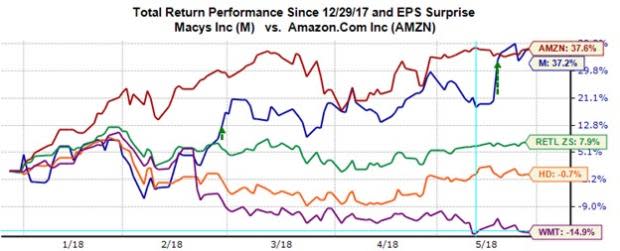
Macy’s shrinking footprint notwithstanding, it represents the department store space in this comparison chart, with Wal-Mart and Home Depot standing in for the big box discount and home-improvement spaces, respectively.
Macy’s long-standing troubles are far from over, but the company appears to be executing well in an otherwise tough environment. The stock’s strong year-to-date performance, almost the same as Amazon’s performance, is more a function of how low expectations had fallen for this department store leader rather than the discovery of a new formula that can help it compete better. That said, market participants appear to be moving away from the overly pessimistic narrative that didn’t see any role for Macy’s and its peers in Retail’s future.
Wal-Mart shares have been struggling since late-January 2018, with the market appearing unwilling to give it the flexibility and space that it routinely allows Amazon. Wal-Mart is investing in its business, both in the brick-and-mortar assets as well as the digital side, and these investments tend to come at the expense of margins and profitability. The company’s Q1 results were decent, but the positive same-store sales growth and impressive ecommerce sales failed to impress skeptical investors focused on more evidence of margin pressures. The market likely also believes that the company overpaid for its India venture through the Flipkart purchase. All in all, the company has a good strategy in place to effectively compete with Amazon in the long run. But no one should be under any illusion about how long and expensive the struggle will be.
Home Depot’s mixed quarterly report can be legitimately chalked up to the weather. But the stock’s year-to-date underperformance likely has more to do with the market’s skepticism about the outlook for the housing space as a whole which has been dealing with low housing inventory and rising mortgage rates.
Retail Sector Scorecard
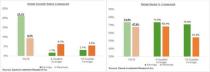
We now have Q1 results from 89.5% of the retailers in the S&P 500 index. Total earnings for these Retail sector companies that have reported results are up +21.1% from the same period last year on +9.3% higher revenues, with 73.5% beating EPS estimates and 67.7% beating revenue estimates.
The comparison charts below put the sector’s Q1 results in a historical context.
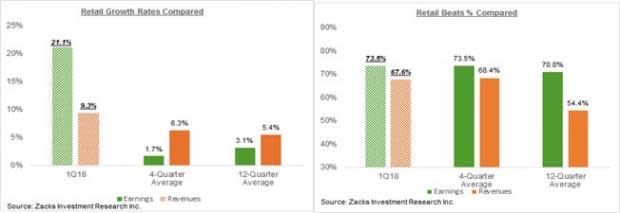
The comparison charts above show that while growth (both earnings as well as revenues) is tracking notably above historical periods, the proportion of positive surprises is in line with previous quarters.
With respect to growth, Amazon’s blockbuster numbers, particularly on the revenues front, have a big role in the sector’s very strong growth pace. Amazon’s Q1 earnings increased +125% on +42.9% higher revenues, with the net dollar increase in the online retailer’s revenues an impressive $15.3 billion.
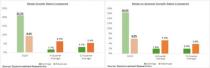
The comparison charts below try to look at the sector’s growth picture with and without the Amazon contribution.
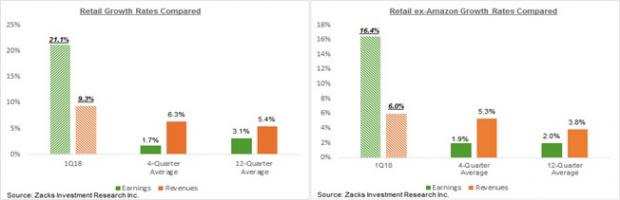
As you can see in the right-hand chart above, Q1 growth is still tracking above historical periods, but the growth rate is a lot lower on an ex-Amazon basis.
Q1 Earnings Season Scorecard (as of Friday, May 25th)
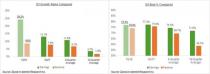
For the S&P 500 index as a whole, we now have Q1 results from 485 index members. Total earnings for the 485 index members that have reported results already are up +24.3% from the same period last year on +8.6% higher revenues, with 77.1% beating EPS estimates and 74.4% beating revenue estimates. The proportion of companies beating both EPS and revenue estimates is 62.3%. Please note that we have 75 companies on deck to report quarterly results this week, including 9 S&P 500 members.
To put these results in a historical context, the charts below compare the results thus far with what we had seen from the same group of 485 index members in other recent periods.
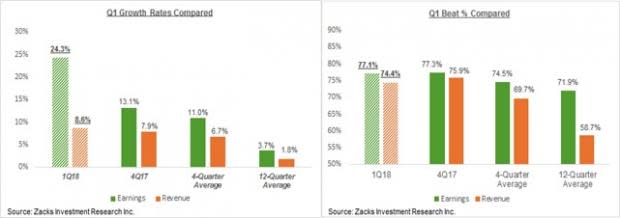
Earnings and revenue growth rate and the proportion of positive EPS surprises is tracking above what we have been seeing from the same group of 485 index members. But revenue surprises are tracking modestly below the preceding earnings season, but remain above historical periods.
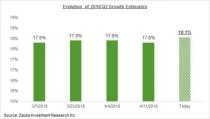
What’s Happening to 2018 Q2 Estimates?
The chart below plots the evolution of earnings growth expectations for the current period. As you can see, there has been no incremental improvement in the earnings outlook relative to what was expected ahead of the start of this earnings season.
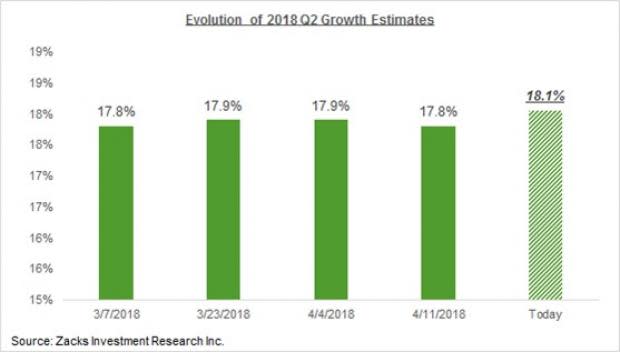
A big part of the positive revisions we saw ahead of the start of the Q1 earnings season reflected the direct impact of the tax law changes, which was obviously a one-off development. Had all positive revisions been a result of tax law changes, we would have seen only EPS estimates go up, with no changes to revenue estimates. But that wasn’t the case, as revenue estimates had gone up as well, which raised our hopes that the aggregate revisions trend had finally turned positive after many years being in the other direction.
Disappointingly, we are not seeing that with estimates for Q2 to the same extent, as the above chart shows. In other words, while the growth picture coming out of this earnings season is very impressive, there is not much improvement in expectations for the current and coming quarters. The recent uptrend in the exchange value of the U.S. dollar and questions about global growth will likely serve as incremental negatives for folks like us monitoring the aggregate revisions trend.
This flat aggregate revisions trend notwithstanding, June quarter estimates have actually modestly ticked down for 9 of the 16 Zacks sectors and gone up for 7 sectors. The sectors enjoying positive revisions in the aggregate include Technology, Energy, Medical, Industrial Products, Basic Materials, Business Services, and Retail.
Note: Sheraz Mian manages the Zacks equity research department. He is an acknowledged earnings expert whose commentaries and analyses appear on Zacks.com and in the print and electronic media. His weekly earnings related articles include Earnings Trends and Earnings Preview. He manages the Zacks Top 10 and Focus List portfolios and writes the Weekly Market Analysis article for Zacks Premium subscribers.
More Stock News: This Is Bigger than the iPhone!
It could become the mother of all technological revolutions. Apple sold a mere 1 billion iPhones in 10 years but a new breakthrough is expected to generate more than 27 billion devices in just 3 years, creating a $1.7 trillion market.
Zacks has just released a Special Report that spotlights this fast-emerging phenomenon and 6 tickers for taking advantage of it. If you don't buy now, you may kick yourself in 2020.
Click here for the 6 trades >>
Here is a list of the 75 companies including 9 S&P 500 and reporting this week.
Company | Ticker | Current Qtr | Year-Ago Qtr | Last EPS Surprise % | Report Day | Time |
LEJU HOLDINGS | LEJU | N/A | -0.21 | 15.79% | Monday | BTO |
BOOZ ALLEN HMLT | BAH | 0.45 | 0.45 | 11.63% | Tuesday | BTO |
MOMO INC -ADR | MOMO | 0.45 | 0.4 | 11.90% | Tuesday | BTO |
BANK OF NOVA SC | BNS | 1.31 | 1.23 | 4.58% | Tuesday | BTO |
JIANPU TECH-ADR | JT | -0.03 | N/A | -650.00% | Tuesday | BTO |
QUOTIENT LTD | QTNT | -0.51 | -0.69 | 14.55% | Tuesday | BTO |
ADV DRAINAG SYS | WMS | -0.06 | -0.34 | 77.78% | Tuesday | BTO |
ELBIT SYSTEMS | ESLT | N/A | 1.21 | N/A | Tuesday | BTO |
AMER WOODMARK | AMWD | 1.12 | 1.13 | -4.55% | Tuesday | BTO |
SALESFORCE.COM | CRM | 0.18 | 0.06 | 36.36% | Tuesday | AMC |
HP INC | HPQ | 0.48 | 0.4 | 14.29% | Tuesday | AMC |
NOAH HLDGS LTD | NOAH | N/A | 0.54 | N/A | Tuesday | AMC |
SAFE BULKERS | SB | 0.02 | -0.07 | -25.00% | Tuesday | AMC |
HEICO CORP | HEI | 0.53 | 0.42 | -12.82% | Tuesday | AMC |
SPARTAN NASH CO | SPTN | 0.54 | 0.55 | -2.38% | Tuesday | AMC |
ANALOG DEVICES | ADI | 1.37 | 1.03 | 10.08% | Wednesday | BTO |
MICHAEL KORS | KORS | 0.6 | 0.73 | 37.21% | Wednesday | BTO |
MOVADO GRP INC | MOV | 0.12 | 0.01 | 100.00% | Wednesday | BTO |
DICKS SPRTG GDS | DKS | 0.42 | 0.54 | 1.67% | Wednesday | BTO |
CHICOS FAS INC | CHS | 0.26 | 0.26 | 37.50% | Wednesday | BTO |
DSW INC CL-A | DSW | 0.36 | 0.32 | 40.74% | Wednesday | BTO |
BANK MONTREAL | BMO | 1.67 | 1.45 | 1.20% | Wednesday | BTO |
GOLDEN OCEAN GP | GOGL | 0.03 | -0.17 | 46.15% | Wednesday | BTO |
RBC BEARINGS | ROLL | 1.13 | 0.9 | 22.09% | Wednesday | BTO |
COLUMBUS MCKINN | CMCO | 0.5 | 0.4 | 41.94% | Wednesday | BTO |
EVINE LIVE INC | EVLV | -0.02 | -0.05 | 0.00% | Wednesday | BTO |
YINTECH INVSTMT | YIN | N/A | 0.77 | N/A | Wednesday | BTO |
NATL BK CDA | NTIOF | 1.1 | 0.98 | 4.46% | Wednesday | BTO |
MAKEMYTRIP LTD | MMYT | -0.4 | -0.42 | 30.51% | Wednesday | BTO |
CSW INDUSTRIALS | CSWI | 0.47 | 0.43 | 10.34% | Wednesday | BTO |
PVH CORP | PVH | 2.25 | 1.65 | 6.76% | Wednesday | AMC |
GUESS INC | GES | -0.23 | -0.24 | 16.98% | Wednesday | AMC |
BOX INC-A | BOX | -0.27 | -0.3 | 4.00% | Wednesday | AMC |
ASCENDIS PHARMA | ASND | -0.93 | -0.83 | -17.39% | Wednesday | AMC |
DESCARTES SYS | DSGX | 0.11 | 0.09 | -10.00% | Wednesday | AMC |
KEYSIGHT TECH | KEYS | 0.76 | 0.59 | 37.50% | Wednesday | AMC |
NGL ENERGY PART | NGL | 0.45 | 0.14 | 68.42% | Wednesday | AMC |
SEMTECH CORP | SMTC | 0.2 | 0.28 | 46.15% | Wednesday | AMC |
AMERCO INC | UHAL | 0.66 | 0.49 | -74.57% | Wednesday | AMC |
TILLYS INC | TLYS | 0.01 | -0.01 | -4.00% | Wednesday | AMC |
QAD INC-A | QADA | -0.04 | -0.13 | -20.83% | Wednesday | AMC |
DOLLAR GENERAL | DG | 1.4 | 1.03 | 0.00% | Thursday | BTO |
DOLLAR TREE INC | DLTR | 1.23 | 0.98 | -0.53% | Thursday | BTO |
DONALDSON CO | DCI | 0.52 | 0.45 | -2.27% | Thursday | BTO |
BURLINGTON STRS | BURL | 1.09 | 0.73 | 3.83% | Thursday | BTO |
GOLAR LNG LTD | GLNG | -0.22 | -0.41 | 60.71% | Thursday | BTO |
J JILL INC | JILL | 0.19 | 0.24 | 62.50% | Thursday | BTO |
GOLAR LNG PARTN | GMLP | 0.09 | 0.35 | 54.17% | Thursday | BTO |
CIENA CORP | CIEN | 0.23 | 0.38 | 0.00% | Thursday | BTO |
EXPRESS INC | EXPR | -0.01 | -0.07 | 6.25% | Thursday | BTO |
FRONTLINE LTD | FRO | -0.17 | 0.16 | 137.50% | Thursday | BTO |
HOEGH LNG PTNRS | HMLP | 0.35 | 0.41 | 67.65% | Thursday | BTO |
TECH DATA CORP | TECD | 1.48 | 1.87 | -0.85% | Thursday | BTO |
KIRKLANDS INC | KIRK | -0.09 | -0.09 | -7.06% | Thursday | BTO |
PERRY ELLIS INT | PERY | 0.66 | 0.83 | 0.00% | Thursday | BTO |
TITAN MACHINERY | TITN | -0.1 | -0.19 | 28.57% | Thursday | BTO |
BUILD-A-BEAR WK | BBW | 0.25 | 0.17 | N/A | Thursday | BTO |
CHRISTOPHER&BNK | CBK | -0.08 | -0.1 | 18.52% | Thursday | BTO |
AMER EAGLE OUTF | AEO | 0.22 | 0.16 | 0.00% | Thursday | BTO |
CANTEL MED CORP | CMD | 0.6 | 0.51 | 1.72% | Thursday | BTO |
ULTA BEAUTY INC | ULTA | 2.48 | 1.91 | -0.72% | Thursday | AMC |
COSTCO WHOLE CP | COST | 1.68 | 1.4 | -2.07% | Thursday | AMC |
WORKDAY INC-A | WDAY | -0.31 | -0.24 | 8.57% | Thursday | AMC |
ORGANOVO HLDGS | ONVO | -0.07 | -0.1 | 30.00% | Thursday | AMC |
LULULEMON ATHLT | LULU | 0.45 | 0.32 | 4.72% | Thursday | AMC |
VMWARE INC-A | VMW | 0.79 | 0.72 | 7.94% | Thursday | AMC |
MARVELL TECH GP | MRVL | 0.26 | 0.2 | 3.70% | Thursday | AMC |
INNERWORKINGS | INWK | 0.09 | 0.08 | -53.85% | Thursday | AMC |
YEXT INC | YEXT | -0.18 | -0.13 | -5.88% | Thursday | AMC |
CALERES INC | CAL | 0.48 | 0.4 | 9.09% | Thursday | AMC |
CSS INDS INC | CSS | -0.56 | -0.21 | 10.95% | Thursday | AMC |
ZUORA INC | ZUO | -0.43 | N/A | N/A | Thursday | AMC |
GAMESTOP CORP | GME | 0.35 | 0.63 | 3.06% | Thursday | AMC |
ABERCROMBIE | ANF | -0.79 | -0.72 | 22.12% | Friday | BTO |
BIG LOTS INC | BIG | 1.21 | 1.15 | 6.20% | Friday | BTO |
Want the latest recommendations from Zacks Investment Research? Today, you can download 7 Best Stocks for the Next 30 Days. Click to get this free report
Walmart Inc. (WMT) : Free Stock Analysis Report
Macy's, Inc. (M) : Free Stock Analysis Report
The Home Depot, Inc. (HD) : Free Stock Analysis Report
Amazon.com, Inc. (AMZN) : Free Stock Analysis Report
To read this article on Zacks.com click here.
Zacks Investment Research
