
 Yahoo Finance
 SVB Financial Group's (NASDAQ:SIVB) five-year total shareholder returns outpace the underlying earnings growth
It hasn't been the best quarter for SVB Financial Group (NASDAQ:SIVB) shareholders, since the share price has fallen 27% in that time. But that doesn't change the fact that shareholders have received really good returns over the last five years. It's fair to say most would be happy with 120% the gain in that time. We think it's more important to dwell on the long term returns than the short term returns. Ultimately business performance will determine whether the stock price continues the positive long term trend.
Since the long term performance has been good but there's been a recent pullback of 3.6%, let's check if the fundamentals match the share price.
See our latest analysis for SVB Financial Group
There is no denying that markets are sometimes efficient, but prices do not always reflect underlying business performance. By comparing earnings per share (EPS) and share price changes over time, we can get a feel for how investor attitudes to a company have morphed over time.
Over half a decade, SVB Financial Group managed to grow its earnings per share at 30% a year. This EPS growth is higher than the 17% average annual increase in the share price. So one could conclude that the broader market has become more cautious towards the stock.
The company's earnings per share (over time) is depicted in the image below (click to see the exact numbers).
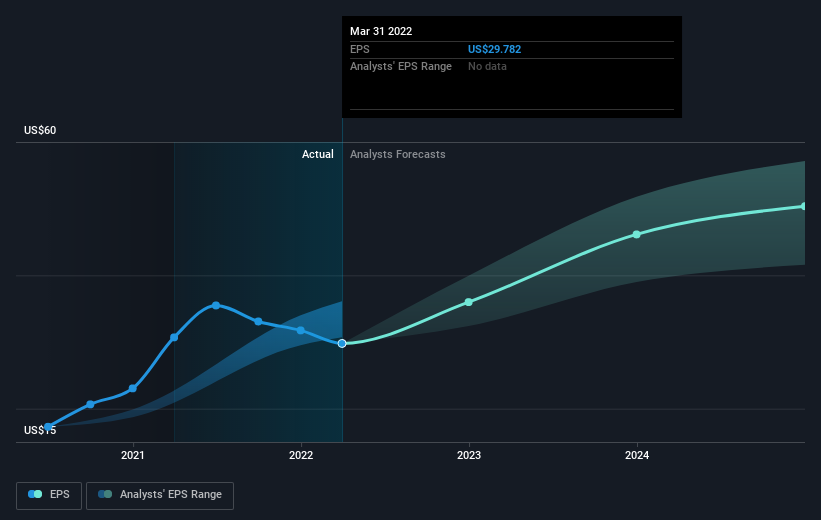
Dive deeper into SVB Financial Group's key metrics by checking this interactive graph of SVB Financial Group's earnings, revenue and cash flow.
A Different Perspective
We regret to report that SVB Financial Group shareholders are down 29% for the year. Unfortunately, that's worse than the broader market decline of 20%. Having said that, it's inevitable that some stocks will be oversold in a falling market. The key is to keep your eyes on the fundamental developments. Longer term investors wouldn't be so upset, since they would have made 17%, each year, over five years. It could be that the recent sell-off is an opportunity, so it may be worth checking the fundamental data for signs of a long term growth trend. I find it very interesting to look at share price over the long term as a proxy for business performance. But to truly gain insight, we need to consider other information, too. To that end, you should be aware of the 2 warning signs we've spotted with SVB Financial Group .
But note: SVB Financial Group may not be the best stock to buy. So take a peek at this free list of interesting companies with past earnings growth (and further growth forecast).
Please note, the market returns quoted in this article reflect the market weighted average returns of stocks that currently trade on US exchanges.
Have feedback on this article? Concerned about the content? Get in touch with us directly. Alternatively, email editorial-team (at) simplywallst.com.
This article by Simply Wall St is general in nature. We provide commentary based on historical data and analyst forecasts only using an unbiased methodology and our articles are not intended to be financial advice. It does not constitute a recommendation to buy or sell any stock, and does not take account of your objectives, or your financial situation. We aim to bring you long-term focused analysis driven by fundamental data. Note that our analysis may not factor in the latest price-sensitive company announcements or qualitative material. Simply Wall St has no position in any stocks mentioned.
