
 Yahoo Finance
 The SysGroup (LON:SYS) Share Price Is Down 52% So Some Shareholders Are Wishing They Sold

We think intelligent long term investing is the way to go. But no-one is immune from buying too high. Zooming in on an example, the SysGroup plc (LON:SYS) share price dropped 52% in the last half decade. That's not a lot of fun for true believers. And it's not just long term holders hurting, because the stock is down 27% in the last year. Furthermore, it's down 14% in about a quarter. That's not much fun for holders. However, one could argue that the price has been influenced by the general market, which is down 25% in the same timeframe.
Check out our latest analysis for SysGroup
Given that SysGroup didn't make a profit in the last twelve months, we'll focus on revenue growth to form a quick view of its business development. Shareholders of unprofitable companies usually expect strong revenue growth. That's because it's hard to be confident a company will be sustainable if revenue growth is negligible, and it never makes a profit.
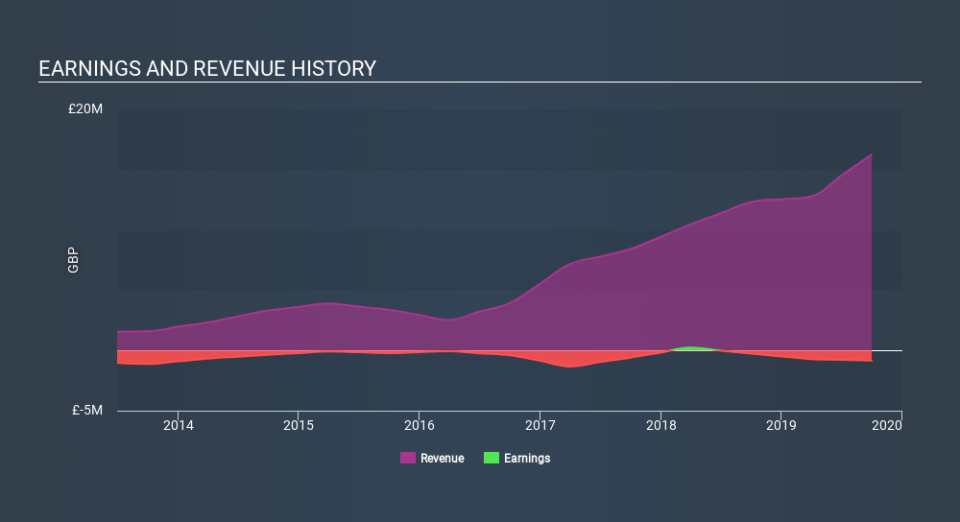
Over five years, SysGroup grew its revenue at 36% per year. That's better than most loss-making companies. In contrast, the share price is has averaged a loss of 14% per year - that's quite disappointing. It's safe to say investor expectations are more grounded now. Given the revenue growth we'd consider the stock to be quite an interesting prospect if the company has a clear path to profitability.
You can see below how earnings and revenue have changed over time (discover the exact values by clicking on the image).
You can see how its balance sheet has strengthened (or weakened) over time in this free interactive graphic.
A Different Perspective
While the broader market lost about 18% in the twelve months, SysGroup shareholders did even worse, losing 27%. Having said that, it's inevitable that some stocks will be oversold in a falling market. The key is to keep your eyes on the fundamental developments. Regrettably, last year's performance caps off a bad run, with the shareholders facing a total loss of 14% per year over five years. We realise that Baron Rothschild has said investors should "buy when there is blood on the streets", but we caution that investors should first be sure they are buying a high quality business. It's always interesting to track share price performance over the longer term. But to understand SysGroup better, we need to consider many other factors. To that end, you should learn about the 3 warning signs we've spotted with SysGroup (including 1 which is makes us a bit uncomfortable) .
If you like to buy stocks alongside management, then you might just love this free list of companies. (Hint: insiders have been buying them).
Please note, the market returns quoted in this article reflect the market weighted average returns of stocks that currently trade on GB exchanges.
If you spot an error that warrants correction, please contact the editor at editorial-team@simplywallst.com. This article by Simply Wall St is general in nature. It does not constitute a recommendation to buy or sell any stock, and does not take account of your objectives, or your financial situation. Simply Wall St has no position in the stocks mentioned.
We aim to bring you long-term focused research analysis driven by fundamental data. Note that our analysis may not factor in the latest price-sensitive company announcements or qualitative material. Thank you for reading.
