
 Yahoo Finance
 Is Tailored Brands (TLRD) a Great Stock for Value Investors?


Value investing is easily one of the most popular ways to find great stocks in any market environment. After all, who wouldn’t want to find stocks that are either flying under the radar and are compelling buys, or offer up tantalizing discounts when compared to fair value?
One way to find these companies is by looking at several key metrics and financial ratios, many of which are crucial in the value stock selection process. Let’s put Tailored Brands, Inc. TLRD stock into this equation and find out if it is a good choice for value-oriented investors right now, or if investors subscribing to this methodology should look elsewhere for top picks:
PE Ratio
A key metric that value investors always look at is the Price to Earnings Ratio, or PE for short. This shows us how much investors are willing to pay for each dollar of earnings in a given stock, and is easily one of the most popular financial ratios in the world. The best use of the PE ratio is to compare the stock’s current PE ratio with: a) where this ratio has been in the past; b) how it compares to the average for the industry/sector; and c) how it compares to the market as a whole.
On this front, Tailored Brands has a trailing twelve months PE ratio of 15.9, as you can see in the chart below:
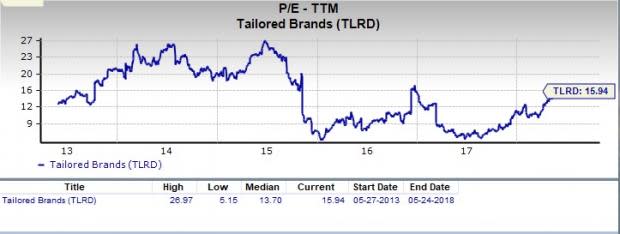
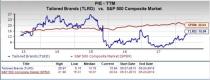
This level actually compares pretty favorably with the market at large, as the PE for the S&P 500 stands at about 20x. If we focus on the long-term PE trend, Tailored Brands’s current PE level puts it above its midpoint over the past five years, with the number having risen rapidly over the past few months.
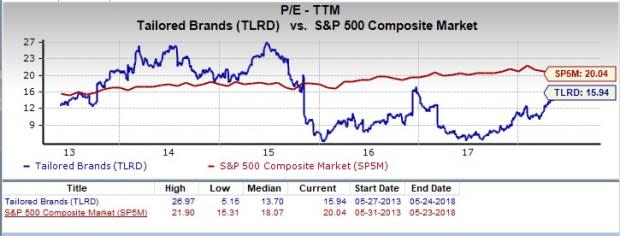
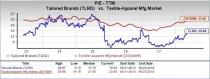
Further, the stock’s PE also compares favorably with its industry’s trailing twelve months PE ratio, which stands at 23.9. At the very least, this indicates that the stock is relatively undervalued right now, compared to its peers.

We should also point out that Tailored Brands has a forward PE ratio (price relative to this year’s earnings) of just 13.6, so it is fair to say that a slightly more value-oriented path may be ahead for Tailored Brands stock in the near term too.
P/S Ratio
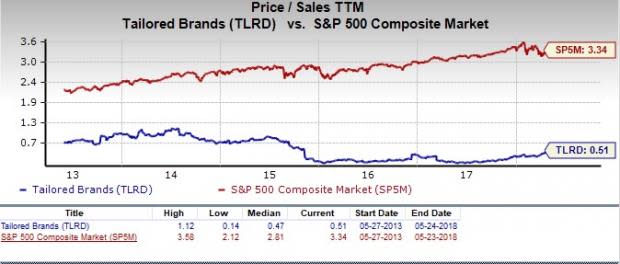
Another key metric to note is the Price/Sales ratio. This approach compares a given stock’s price to its total sales, where a lower reading is generally considered better. Some people like this metric more than other value-focused ones because it looks at sales, something that is far harder to manipulate with accounting tricks than earnings.
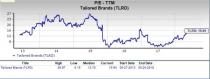
Right now, Tailored Brands has a P/S ratio of about 0.5. This is a bit lower than the S&P 500 average, which comes in at 3.3x right now. Also, as we can see in the chart below, this is well below the highs for this stock in particular over the past few years.
Broad Value Outlook
In aggregate, Tailored Brands currently has a Value Score of B, putting it into the top 40% of all stocks we cover from this look. This makes Tailored Brands a solid choice for value investors.
What About the Stock Overall?
Though Tailored Brands might be a good choice for value investors, there are plenty of other factors to consider before investing in this name. In particular, it is worth noting that the company has a Growth Score of A and a Momentum Score of F. This gives TLRD a Zacks VGM score — or its overarching fundamental grade — of A. (You can read more about the Zacks Style Scores here >>)
Meanwhile, the company’s recent earnings estimates have been upbeat. Both the current year and next year have seen two estimates go higher in the past sixty days compared to no lower.
This has had a significant impact on the consensus estimate as the current year consensus estimate has risen by 1.6% in the past two months, while the next year estimate has increased 5.9%. You can see the consensus estimate trend and recent price action for the stock in the chart below:
Tailored Brands, Inc. Price and Consensus
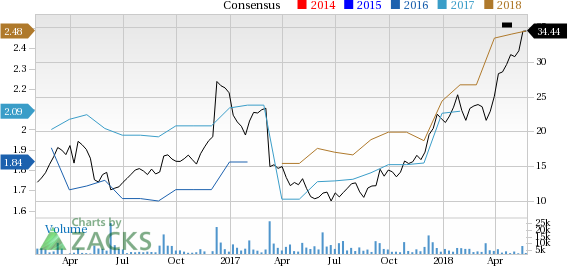
Tailored Brands, Inc. Price and Consensus | Tailored Brands, Inc. Quote
This positive trend signifies bullish analyst sentiment, and its Zacks Rank #2 (Buy) indicates robust fundamentals and expectations of outperformance in the near term.
Bottom Line
Tailored Brands is an inspired choice for value investors, as it is hard to beat its incredible lineup of statistics on this front. Further, a strong industry rank (among Top 21% of more than 250 industries) instills our confidence.
However, over the past two years, the broader industry has clearly underperformed the market at large, as you can see below:
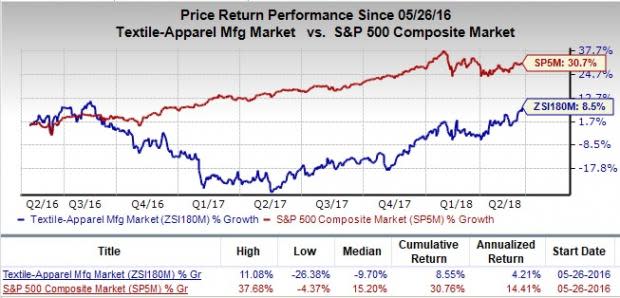
We believe, despite an unsatisfactory past industry performance, a good industry and Zacks rank signal that the stock is likely to benefit from favorable broader factors in the immediate future. Add to this robust value metrics, and we believe that we have a strong value contender in Tailored Brands.
Looking for Stocks with Skyrocketing Upside?
Zacks has just released a Special Report on the booming investment opportunities of legal marijuana.
Ignited by new referendums and legislation, this industry is expected to blast from an already robust $6.7 billion to $20.2 billion in 2021. Early investors stand to make a killing, but you have to be ready to act and know just where to look.
See the pot trades we're targeting>>
Want the latest recommendations from Zacks Investment Research? Today, you can download 7 Best Stocks for the Next 30 Days. Click to get this free report
Tailored Brands, Inc. (TLRD) : Free Stock Analysis Report
To read this article on Zacks.com click here.
Zacks Investment Research
