
 Yahoo Finance
 As Tanger Factory Outlet Centers (NYSE:SKT) lifts 4.3% this past week, investors may now be noticing the company's five-year earnings growth
Tanger Factory Outlet Centers, Inc. (NYSE:SKT) shareholders should be happy to see the share price up 12% in the last quarter. But if you look at the last five years the returns have not been good. After all, the share price is down 28% in that time, significantly under-performing the market.
On a more encouraging note the company has added US$79m to its market cap in just the last 7 days, so let's see if we can determine what's driven the five-year loss for shareholders.
View our latest analysis for Tanger Factory Outlet Centers
In his essay The Superinvestors of Graham-and-Doddsville Warren Buffett described how share prices do not always rationally reflect the value of a business. One way to examine how market sentiment has changed over time is to look at the interaction between a company's share price and its earnings per share (EPS).
During five years of share price growth, Tanger Factory Outlet Centers moved from a loss to profitability. Most would consider that to be a good thing, so it's counter-intuitive to see the share price declining. Other metrics may better explain the share price move.
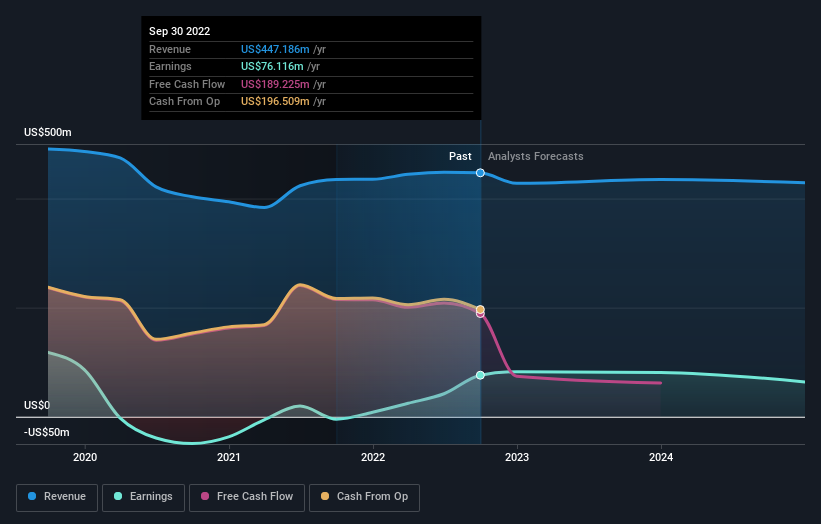
The most recent dividend was actually lower than it was in the past, so that may have sent the share price lower. On top of that, revenue has declined by 4.0% per year over the half decade; that could be a red flag for some investors.
The image below shows how earnings and revenue have tracked over time (if you click on the image you can see greater detail).
We know that Tanger Factory Outlet Centers has improved its bottom line lately, but what does the future have in store? This free report showing analyst forecasts should help you form a view on Tanger Factory Outlet Centers
What About Dividends?
As well as measuring the share price return, investors should also consider the total shareholder return (TSR). The TSR incorporates the value of any spin-offs or discounted capital raisings, along with any dividends, based on the assumption that the dividends are reinvested. It's fair to say that the TSR gives a more complete picture for stocks that pay a dividend. In the case of Tanger Factory Outlet Centers, it has a TSR of -2.8% for the last 5 years. That exceeds its share price return that we previously mentioned. This is largely a result of its dividend payments!
A Different Perspective
It's good to see that Tanger Factory Outlet Centers has rewarded shareholders with a total shareholder return of 3.0% in the last twelve months. And that does include the dividend. There's no doubt those recent returns are much better than the TSR loss of 0.6% per year over five years. The long term loss makes us cautious, but the short term TSR gain certainly hints at a brighter future. It's always interesting to track share price performance over the longer term. But to understand Tanger Factory Outlet Centers better, we need to consider many other factors. For instance, we've identified 3 warning signs for Tanger Factory Outlet Centers (2 are a bit unpleasant) that you should be aware of.
Of course Tanger Factory Outlet Centers may not be the best stock to buy. So you may wish to see this free collection of growth stocks.
Please note, the market returns quoted in this article reflect the market weighted average returns of stocks that currently trade on US exchanges.
Have feedback on this article? Concerned about the content? Get in touch with us directly. Alternatively, email editorial-team (at) simplywallst.com.
This article by Simply Wall St is general in nature. We provide commentary based on historical data and analyst forecasts only using an unbiased methodology and our articles are not intended to be financial advice. It does not constitute a recommendation to buy or sell any stock, and does not take account of your objectives, or your financial situation. We aim to bring you long-term focused analysis driven by fundamental data. Note that our analysis may not factor in the latest price-sensitive company announcements or qualitative material. Simply Wall St has no position in any stocks mentioned.
Join A Paid User Research Session
You’ll receive a US$30 Amazon Gift card for 1 hour of your time while helping us build better investing tools for the individual investors like yourself. Sign up here
