
 Yahoo Finance
 Taubman Centers (TCO) Q1 FFO Beats Estimates, Revenues Down

Retail real estate investment trust (REIT) Taubman Centers Inc. TCO reported first-quarter 2018 adjusted funds from operations (FFO) per share of $1.04, surpassing the Zacks Consensus Estimate of 92 cents. The figure also came in 13% higher than the year-ago tally of 92 cents.
Adjusted revenues, including minimum rents, overage rents and expense recoveries, for the quarter came in at $141 million, missing the Zacks Consensus Estimate of $144 million. Also, revenues were down nearly 2% from the prior-year quarter.
The quarter experienced higher rents and greater lease cancellation income. Further, cost-saving initiatives executed in the previous year enabled the company to enjoy lower general and administrative expenses.
Quarter in Detail
Comparable center net operating income (NOI) climbed 9.2% for the quarter. Average rent per square foot in comparable centers came in at $57.73, up 3.9% from the prior-year quarter. For the period ended Mar 31, 2018, the trailing 12-month releasing spreads per square foot were 4.4%.
Moreover, comparable center mall tenant sales per square foot rose 12.4% in the reported quarter. Further, the company’s 12-month trailing comparable center mall tenant sales per square foot came in at $837, marking a 5% increase.
As of Mar 31, 2018, leased space in comparable centers was 95%. Additionally, ending occupancy in comparable centers was 92.8% on Mar 31, 2018, flat year over year.
Liquidity
Taubman Centers exited the first quarter with cash and cash equivalents of $53.9 million, up from the $42.5 million reported at year-end 2017.
Guidance
The company projects 2018 adjusted FFO per share of $3.72-$3.86, which remained unchanged from the previous outlook. The Zacks Consensus Estimate for the same is pegged at $3.76.
The full-year FFO per share guidance continues to be backed by assumptions of comparable center NOI growth of about 2-3% for the year. Also, the guidance does not include any future costs that might be incurred related to shareowner activism.
Our Viewpoint
Taubman recorded encouraging NOI growth during the Jan-Mar quarter. The company’s operating performance benefited from the new comparable centers in the quarter. In addition, it witnessed robust growth in sales per square foot.
However, the prevalent choppy retail real estate environment remains a concern for the company. In fact, with a rapid shift in customers’ shopping preferences and growing online retail, mall traffic continues to suffer. These have made retailers reconsider their footprint and eventually opt for store closures. This is expected to impact demand for retail space at Taubman’s shopping centers. Furthermore, it has been witnessing elevated levels of tenant turnover for the past two years.
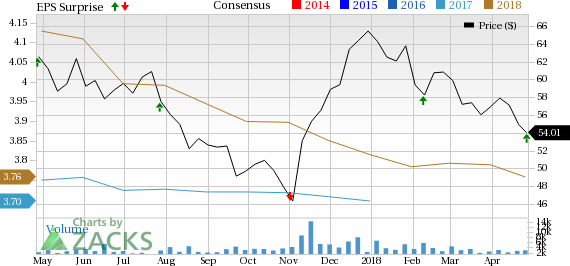
Taubman Centers, Inc. Price, Consensus and EPS Surprise
Taubman Centers, Inc. Price, Consensus and EPS Surprise | Taubman Centers, Inc. Quote
Currently, Taubman Centers has a Zacks Rank #3 (Hold).
You can see the complete list of today’s Zacks #1 Rank (Strong Buy) stocks here.
We now look forward to the earnings releases of other REITs like Alexandria Real Estate Equities, Inc. ARE, Essex Property Trust Inc. ESS and Regency Centers Corporation REG. Alexandria and Regency Centers are scheduled to release results on Apr 30, while Essex Property is slated to report its numbers on May 2.
Note: Anything related to earnings presented in this write-up represent funds from operations (FFO) — a widely used metric to gauge the performance of REITs.
Looking for Stocks with Skyrocketing Upside?
Zacks has just released a Special Report on the booming investment opportunities of legal marijuana.
Ignited by new referendums and legislation, this industry is expected to blast from an already robust $6.7 billion to $20.2 billion in 2021. Early investors stand to make a killing, but you have to be ready to act and know just where to look.
See the pot trades we're targeting>>
Want the latest recommendations from Zacks Investment Research? Today, you can download 7 Best Stocks for the Next 30 Days. Click to get this free report
Taubman Centers, Inc. (TCO) : Free Stock Analysis Report
Regency Centers Corporation (REG) : Free Stock Analysis Report
Essex Property Trust, Inc. (ESS) : Free Stock Analysis Report
Alexandria Real Estate Equities, Inc. (ARE) : Free Stock Analysis Report
To read this article on Zacks.com click here.
Zacks Investment Research
