
 Yahoo Finance
 Taylor Wimpey (LON:TW.) Might Be Having Difficulty Using Its Capital Effectively
If you're not sure where to start when looking for the next multi-bagger, there are a few key trends you should keep an eye out for. Firstly, we'd want to identify a growing return on capital employed (ROCE) and then alongside that, an ever-increasing base of capital employed. Put simply, these types of businesses are compounding machines, meaning they are continually reinvesting their earnings at ever-higher rates of return. In light of that, when we looked at Taylor Wimpey (LON:TW.) and its ROCE trend, we weren't exactly thrilled.
Understanding Return On Capital Employed (ROCE)
For those who don't know, ROCE is a measure of a company's yearly pre-tax profit (its return), relative to the capital employed in the business. Analysts use this formula to calculate it for Taylor Wimpey:
Return on Capital Employed = Earnings Before Interest and Tax (EBIT) ÷ (Total Assets - Current Liabilities)
0.15 = UK£764m ÷ (UK£6.2b - UK£1.1b) (Based on the trailing twelve months to July 2021).
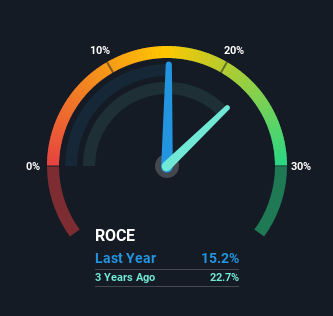
So, Taylor Wimpey has an ROCE of 15%. In absolute terms, that's a satisfactory return, but compared to the Consumer Durables industry average of 9.6% it's much better.
View our latest analysis for Taylor Wimpey
Above you can see how the current ROCE for Taylor Wimpey compares to its prior returns on capital, but there's only so much you can tell from the past. If you're interested, you can view the analysts predictions in our free report on analyst forecasts for the company.
The Trend Of ROCE
On the surface, the trend of ROCE at Taylor Wimpey doesn't inspire confidence. Over the last five years, returns on capital have decreased to 15% from 19% five years ago. However, given capital employed and revenue have both increased it appears that the business is currently pursuing growth, at the consequence of short term returns. And if the increased capital generates additional returns, the business, and thus shareholders, will benefit in the long run.
On a side note, Taylor Wimpey has done well to pay down its current liabilities to 18% of total assets. So we could link some of this to the decrease in ROCE. What's more, this can reduce some aspects of risk to the business because now the company's suppliers or short-term creditors are funding less of its operations. Since the business is basically funding more of its operations with it's own money, you could argue this has made the business less efficient at generating ROCE.
The Bottom Line
While returns have fallen for Taylor Wimpey in recent times, we're encouraged to see that sales are growing and that the business is reinvesting in its operations. In light of this, the stock has only gained 30% over the last five years. So this stock may still be an appealing investment opportunity, if other fundamentals prove to be sound.
On a final note, we've found 2 warning signs for Taylor Wimpey that we think you should be aware of.
While Taylor Wimpey isn't earning the highest return, check out this free list of companies that are earning high returns on equity with solid balance sheets.
Have feedback on this article? Concerned about the content? Get in touch with us directly. Alternatively, email editorial-team (at) simplywallst.com.
This article by Simply Wall St is general in nature. We provide commentary based on historical data and analyst forecasts only using an unbiased methodology and our articles are not intended to be financial advice. It does not constitute a recommendation to buy or sell any stock, and does not take account of your objectives, or your financial situation. We aim to bring you long-term focused analysis driven by fundamental data. Note that our analysis may not factor in the latest price-sensitive company announcements or qualitative material. Simply Wall St has no position in any stocks mentioned.
