TC PipeLines' (TCP) Earnings and DCF Decrease Y/Y in Q1
TC PipeLines TCP witnessed disappointing earnings in first-quarter 2020. The firm reported earnings of $1.21 a unit, down 5.46% from $1.28 in the year-ago quarter due to a drop in PNGTS' net income, mainly resulting from lower revenues.
Also, quarterly transmission revenues of $101 million compared unfavorably with $113 million recorded in first-quarter 2019.
Distribution & Cash Flow
TC PipeLines announced first-quarter cash distribution of 65 cents per unit, in line with the year-ago figure. Notably, this marks the 84thquarterly distribution by the partnership.
The firm's distributable cash flow (DCF) decreased to $88 million in the quarter under review from $116 million in the year-ago period due to reduced net cash flow from operations at the company’s consolidated subsidiaries, thanks to soft revenues. However, the coverage ratio for the first quarter came in at impressive 1.9 times. A coverage ratio in excess of 1 implies that the partnership is generating more than enough cash in the given period to cover its distribution.
In the reported quarter, TC PipeLines distributed $55 million in cash, lower than the year-ago level.
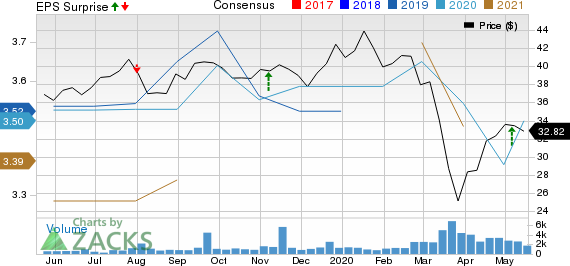
TC PipeLines, LP Price, Consensus and EPS Surprise

TC PipeLines, LP price-consensus-eps-surprise-chart | TC PipeLines, LP Quote
Pipeline Systems' Performance
Great Lakes: Earnings of $20 million generated from equity investment matched the prior-year quarter’s figure.
Northern Border Pipeline: Equity earnings totaled $22 million, marginally higher than the prior-year level.
Iroquois: Equity earnings amounted to $13 million, flat with the prior-year figure.
Expenses
Operation and maintenance expenses were $16 million in the quarter, unchanged from the year-ago number. General/administrative expenses summed $1 million, slightly lower than the year-ago number. Property taxes declined to $6 million from $7million a year ago. Depreciation costs came in at $20 million, same as the year-ago level. Financial and other charges also fell to $19 million from $22 million in the corresponding period of 2019.
Balance Sheet
As of Mar 31, TC PipeLines’ cash and cash equivalents were worth $134 million. The partnership had a long-term debt of $1.9 billion, representing total debt to total capital of 70.8%.
Zacks Rank & Key Picks
TC Pipelines has a Zacks Rank #3 (Hold). Among other players in the energy sector that reported first-quarter earnings so far, the bottom-line results of Cheniere Energy Inc. LNG, Murphy USA Inc. MUSA and Williams Companies Inc. WMB beat the respective Zacks Consensus Estimate by 204.3%, 4.3% and 4%. While Cheniere Energy and Williams Companies carry a Zacks Rank #2 (Buy), Murphy sports a Zacks Rank #1 (Strong Buy).You can see the complete list of today’s Zacks #1 Rank stocks here.
Today's Best Stocks from Zacks
Would you like to see the updated picks from our best market-beating strategies? From 2017 through 2019, while the S&P 500 gained and impressive +53.6%, five of our strategies returned +65.8%, +97.1%, +118.0%, +175.7% and even +186.7%.
This outperformance has not just been a recent phenomenon. From 2000 – 2019, while the S&P averaged +6.0% per year, our top strategies averaged up to +54.7% per year.
See their latest picks free >>
Want the latest recommendations from Zacks Investment Research? Today, you can download 7 Best Stocks for the Next 30 Days. Click to get this free report
Williams Companies, Inc. The (WMB) : Free Stock Analysis Report
Cheniere Energy, Inc. (LNG) : Free Stock Analysis Report
TC PipeLines, LP (TCP) : Free Stock Analysis Report
Murphy USA Inc. (MUSA) : Free Stock Analysis Report
To read this article on Zacks.com click here.
Zacks Investment Research

 Yahoo Finance