
 Yahoo Finance
 Teck Resources' (TSE:TECK.B) Returns On Capital Not Reflecting Well On The Business
What trends should we look for it we want to identify stocks that can multiply in value over the long term? Firstly, we'll want to see a proven return on capital employed (ROCE) that is increasing, and secondly, an expanding base of capital employed. If you see this, it typically means it's a company with a great business model and plenty of profitable reinvestment opportunities. Having said that, from a first glance at Teck Resources (TSE:TECK.B) we aren't jumping out of our chairs at how returns are trending, but let's have a deeper look.
What Is Return On Capital Employed (ROCE)?
If you haven't worked with ROCE before, it measures the 'return' (pre-tax profit) a company generates from capital employed in its business. Analysts use this formula to calculate it for Teck Resources:
Return on Capital Employed = Earnings Before Interest and Tax (EBIT) ÷ (Total Assets - Current Liabilities)
0.074 = CA$3.7b ÷ (CA$56b - CA$5.9b) (Based on the trailing twelve months to December 2023).
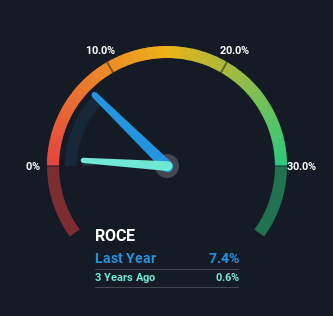
Thus, Teck Resources has an ROCE of 7.4%. In absolute terms, that's a low return, but it's much better than the Metals and Mining industry average of 1.3%.
Check out our latest analysis for Teck Resources
In the above chart we have measured Teck Resources' prior ROCE against its prior performance, but the future is arguably more important. If you'd like to see what analysts are forecasting going forward, you should check out our free analyst report for Teck Resources .
So How Is Teck Resources' ROCE Trending?
In terms of Teck Resources' historical ROCE movements, the trend isn't fantastic. Over the last five years, returns on capital have decreased to 7.4% from 10% five years ago. And considering revenue has dropped while employing more capital, we'd be cautious. This could mean that the business is losing its competitive advantage or market share, because while more money is being put into ventures, it's actually producing a lower return - "less bang for their buck" per se.
The Key Takeaway
In summary, we're somewhat concerned by Teck Resources' diminishing returns on increasing amounts of capital. The market must be rosy on the stock's future because even though the underlying trends aren't too encouraging, the stock has soared 115%. In any case, the current underlying trends don't bode well for long term performance so unless they reverse, we'd start looking elsewhere.
On a final note, we found 2 warning signs for Teck Resources (1 is potentially serious) you should be aware of.
While Teck Resources isn't earning the highest return, check out this free list of companies that are earning high returns on equity with solid balance sheets.
Have feedback on this article? Concerned about the content? Get in touch with us directly. Alternatively, email editorial-team (at) simplywallst.com.
This article by Simply Wall St is general in nature. We provide commentary based on historical data and analyst forecasts only using an unbiased methodology and our articles are not intended to be financial advice. It does not constitute a recommendation to buy or sell any stock, and does not take account of your objectives, or your financial situation. We aim to bring you long-term focused analysis driven by fundamental data. Note that our analysis may not factor in the latest price-sensitive company announcements or qualitative material. Simply Wall St has no position in any stocks mentioned.
