
 Yahoo Finance
 Should Telecom Plus PLC’s (LON:TEP) Recent Earnings Worry You?

Analyzing Telecom Plus PLC’s (LON:TEP) track record of past performance is a valuable exercise for investors. It enables us to reflect on whether or not the company has met expectations, which is a powerful signal for future performance. Today I will assess TEP’s recent performance announced on 31 March 2018 and compare these figures to its long-term trend and industry movements.
Check out our latest analysis for Telecom Plus
Did TEP’s recent performance beat its trend and industry?
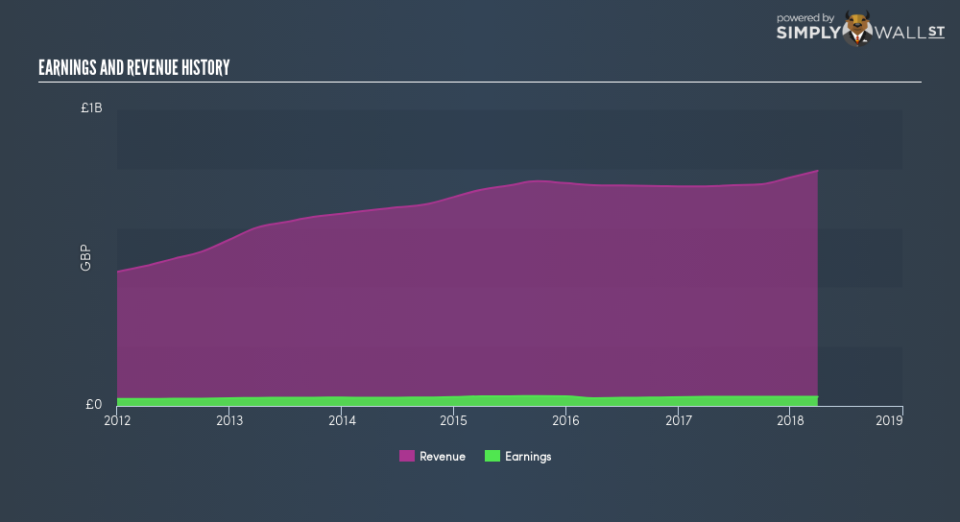
TEP’s trailing twelve-month earnings (from 31 March 2018) of UK£30m has increased by 0.2% compared to the previous year.
However, this one-year growth rate has been lower than its average earnings growth rate over the past 5 years of 2.1%, indicating the rate at which TEP is growing has slowed down. What could be happening here? Well, let’s examine what’s occurring with margins and if the whole industry is experiencing the hit as well.
In terms of returns from investment, Telecom Plus has fallen short of achieving a 20% return on equity (ROE), recording 13% instead. However, its return on assets (ROA) of 7.2% exceeds the GB Integrated Utilities industry of 3.7%, indicating Telecom Plus has used its assets more efficiently. And finally, its return on capital (ROC), which also accounts for Telecom Plus’s debt level, has increased over the past 3 years from 13% to 16%.
What does this mean?
Though Telecom Plus’s past data is helpful, it is only one aspect of my investment thesis. Positive growth and profitability are what investors like to see in a company’s track record, but how do we properly assess sustainability? I recommend you continue to research Telecom Plus to get a more holistic view of the stock by looking at:
Future Outlook: What are well-informed industry analysts predicting for TEP’s future growth? Take a look at our free research report of analyst consensus for TEP’s outlook.
Financial Health: Are TEP’s operations financially sustainable? Balance sheets can be hard to analyze, which is why we’ve done it for you. Check out our financial health checks here.
Other High-Performing Stocks: Are there other stocks that provide better prospects with proven track records? Explore our free list of these great stocks here.
NB: Figures in this article are calculated using data from the trailing twelve months from 31 March 2018. This may not be consistent with full year annual report figures.
To help readers see past the short term volatility of the financial market, we aim to bring you a long-term focused research analysis purely driven by fundamental data. Note that our analysis does not factor in the latest price-sensitive company announcements.
The author is an independent contributor and at the time of publication had no position in the stocks mentioned. For errors that warrant correction please contact the editor at editorial-team@simplywallst.com.
