
 Yahoo Finance
 How Telenav, Inc. (NASDAQ:TNAV) Can Impact Your Portfolio Volatility

If you’re interested in Telenav, Inc. (NASDAQ:TNAV), then you might want to consider its beta (a measure of share price volatility) in order to understand how the stock could impact your portfolio. Modern finance theory considers volatility to be a measure of risk, and there are two main types of price volatility. The first category is company specific volatility. This can be dealt with by limiting your exposure to any particular stock. The second sort is caused by the natural volatility of markets, overall. For example, certain macroeconomic events will impact (virtually) all stocks on the market.
Some stocks are more sensitive to general market forces than others. Beta can be a useful tool to understand how much a stock is influenced by market risk (volatility). However, Warren Buffett said ‘volatility is far from synonymous with risk’ in his 2014 letter to investors. So, while useful, beta is not the only metric to consider. To use beta as an investor, you must first understand that the overall market has a beta of one. Any stock with a beta of greater than one is considered more volatile than the market, while those with a beta below one are either less volatile or poorly correlated with the market.
See our latest analysis for Telenav
What we can learn from TNAV’s beta value
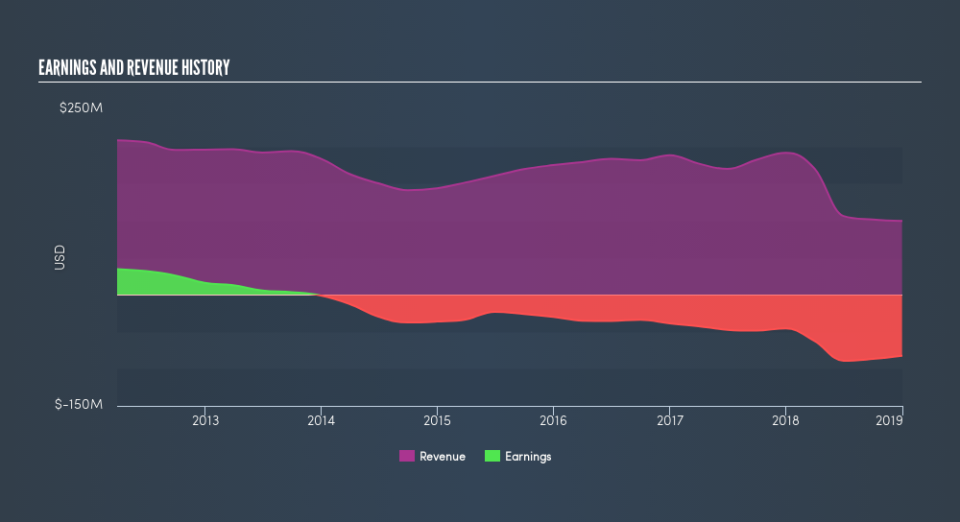
Telenav has a five-year beta of 0.97. This is reasonably close to the market beta of 1, so the stock has in the past displayed similar levels of volatility to the overall market. If the future looks like the past, we could therefore consider it likely that the stock price will experience share price volatility that is roughly similar to the overall market. Share price volatility is well worth considering, but most long term investors consider the history of revenue and earnings growth to be more important. Take a look at how Telenav fares in that regard, below.
How does TNAV’s size impact its beta?
Telenav is a noticeably small company, with a market capitalisation of US$276m. Most companies this size are not always actively traded. Companies this small are usually more volatile than the market, whether or not that volatility is correlated. Therefore, it’s a bit surprising to see that this stock has a beta value so close to the overall market.
What this means for you:
Since Telenav has a beta close to one, it will probably show a positive return when the market is moving up, based on history. If you’re trying to generate better returns than the market, it would be worth thinking about other metrics such as cashflows, dividends and revenue growth might be a more useful guide to the future. In order to fully understand whether TNAV is a good investment for you, we also need to consider important company-specific fundamentals such as Telenav’s financial health and performance track record. I urge you to continue your research by taking a look at the following:
Future Outlook: What are well-informed industry analysts predicting for TNAV’s future growth? Take a look at our free research report of analyst consensus for TNAV’s outlook.
Past Track Record: Has TNAV been consistently performing well irrespective of the ups and downs in the market? Go into more detail in the past performance analysis and take a look at the free visual representations of TNAV’s historicals for more clarity.
Other Interesting Stocks: It’s worth checking to see how TNAV measures up against other companies on valuation. You could start with this free list of prospective options.
We aim to bring you long-term focused research analysis driven by fundamental data. Note that our analysis may not factor in the latest price-sensitive company announcements or qualitative material.
If you spot an error that warrants correction, please contact the editor at editorial-team@simplywallst.com. This article by Simply Wall St is general in nature. It does not constitute a recommendation to buy or sell any stock, and does not take account of your objectives, or your financial situation. Simply Wall St has no position in the stocks mentioned. Thank you for reading.
