
 Yahoo Finance
 Is Telit Communications PLC’s (LON:TCM) Balance Sheet Strong Enough To Weather A Storm?

Investors are always looking for growth in small-cap stocks like Telit Communications PLC (LON:TCM), with a market cap of UK£179m. However, an important fact which most ignore is: how financially healthy is the business? Companies operating in the Communications industry, in particular ones that run negative earnings, tend to be high risk. Assessing first and foremost the financial health is vital. I believe these basic checks tell most of the story you need to know. However, given that I have not delve into the company-specifics, I’d encourage you to dig deeper yourself into TCM here.
How does TCM’s operating cash flow stack up against its debt?
TCM has built up its total debt levels in the last twelve months, from US$45m to US$63m , which accounts for long term debt. With this increase in debt, TCM’s cash and short-term investments stands at US$37m for investing into the business. On top of this, TCM has generated cash from operations of US$20m during the same period of time, resulting in an operating cash to total debt ratio of 31%, meaning that TCM’s debt is appropriately covered by operating cash. This ratio can also be interpreted as a measure of efficiency for unprofitable companies as traditional metrics such as return on asset (ROA) requires positive earnings. In TCM’s case, it is able to generate 0.31x cash from its debt capital.
Does TCM’s liquid assets cover its short-term commitments?
At the current liabilities level of US$152m, the company has maintained a safe level of current assets to meet its obligations, with the current ratio last standing at 1.06x. Usually, for Communications companies, this is a suitable ratio as there’s enough of a cash buffer without holding too much capital in low return investments.
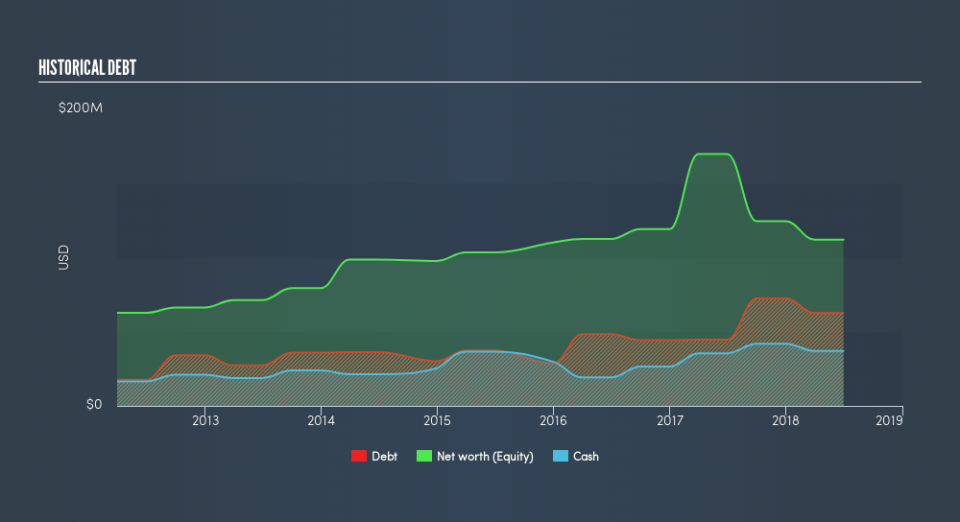
Can TCM service its debt comfortably?
With a debt-to-equity ratio of 56%, TCM can be considered as an above-average leveraged company. This is not uncommon for a small-cap company given that debt tends to be lower-cost and at times, more accessible. But since TCM is currently unprofitable, sustainability of its current state of operations becomes a concern. Running high debt, while not yet making money, can be risky in unexpected downturns as liquidity may dry up, making it hard to operate.
Next Steps:
TCM’s high cash coverage means that, although its debt levels are high, the company is able to utilise its borrowings efficiently in order to generate cash flow. This may mean this is an optimal capital structure for the business, given that it is also meeting its short-term commitment. This is only a rough assessment of financial health, and I’m sure TCM has company-specific issues impacting its capital structure decisions. I recommend you continue to research Telit Communications to get a better picture of the small-cap by looking at:
Future Outlook: What are well-informed industry analysts predicting for TCM’s future growth? Take a look at our free research report of analyst consensus for TCM’s outlook.
Valuation: What is TCM worth today? Is the stock undervalued, even when its growth outlook is factored into its intrinsic value? The intrinsic value infographic in our free research report helps visualize whether TCM is currently mispriced by the market.
Other High-Performing Stocks: Are there other stocks that provide better prospects with proven track records? Explore our free list of these great stocks here.
We aim to bring you long-term focused research analysis driven by fundamental data. Note that our analysis may not factor in the latest price-sensitive company announcements or qualitative material.
If you spot an error that warrants correction, please contact the editor at editorial-team@simplywallst.com. This article by Simply Wall St is general in nature. It does not constitute a recommendation to buy or sell any stock, and does not take account of your objectives, or your financial situation. Simply Wall St has no position in the stocks mentioned. Thank you for reading.
