
 Yahoo Finance
 TELUS (TU) Down 1.6% Since Earnings Report: Can It Rebound?

A month has gone by since the last earnings report for TELUS Corporation TU. Shares have lost about 1.6% in that time frame.
Will the recent negative trend continue leading up to its next earnings release, or is TU due for a breakout? Before we dive into how investors and analysts have reacted as of late, let's take a quick look at the most recent earnings report in order to get a better handle on the important catalysts.
TELUS Beats on Q1 Earnings & Revenues, Updates View
TELUS reported healthy results for the first quarter of 2018, wherein both the top line and the bottom line surpassed the Zacks Consensus Estimate.
The reported quarter’s financials reflect the adoption of IFRS 15 (revenues from contracts with customers) and IFRS 9 (Financial Instruments) on Jan 1, 2018. Results for prior-year quarter have been adjusted to reflect the retrospective application of IFRS 15 and IFRS 9.
Net Income
According to IFRS, net income for the quarter came in at CAD 410 million ($324.3 million), down 1% year over year. Adjusted earnings per share improved 2.8% year over year to CAD 0.73 (60 cents), primarily driven by solid growth in revenues in both operating segments. The bottom line surpassed the Zacks Consensus Estimate of 59 cents.
Revenues
Quarterly consolidated revenues increased 6% year over year to CAD 3,377 million ($2,672 million), beating the Zacks Consensus Estimate of $2,624 million. The year-over-year increase reflected strong customer growth including 76,000 new postpaid wireless, Internet and TV customer additions.
Operating Metrics
Operating income (before depreciation and amortization) was CAD 1,269 million ($1,003.7 million), up 2.7% year over year. Adjusted EBITDA (earnings before interest, tax, depreciation and amortization) was CAD 1,303 million ($1,030.6 million), up 5.2% year over year. Adjusted EBITDA margin was 38.6% compared with 38.9% in the year-ago quarter.
Segmental Performance
Wireless operating revenues increased 6.6% year over year to CAD 1,901 million ($1,503.5 million).
Wireless network revenues increased 4% to CAD 1,472 million ($1,164.2 million), largely driven by growth in the postpaid subscriber base including subscribers from MTS. Equipment and other service revenues were CAD 411 million ($325.1 million), up 15.8% year over year, mainly due to higher retention volumes, postpaid gross additions and increase in higher-valued smartphones in the sales mix.
Adjusted EBITDA of CAD 846 million ($669.1 million) increased 6% from the prior-year quarter figure, reflecting higher network revenues and improvement in equipment margins. Adjusted EBITDA margin was 44.5% compared with 44.7% in the year-ago quarter. Wireless capital expenditures declined 26.9% year over year to CAD 182 million ($143.9 million), as the company incurred costs in the first quarter of 2017 for the hardware upgrade of wireless billing system.
Wireline operating revenues increased 5.1% year over year to CAD 1,539 million ($1,217.2 million).
Data services revenues were CAD 1,089 million ($861.3 million), up 9.8%. This was due to growth in CCBS outsourcing revenues primarily backed by growth in business volumes from recent acquisitions, increased Internet and enhanced data revenues from continued high-speed Internet subscriber growth and higher revenues per customer. Increased TELUS TV revenues resulting from continued subscriber growth, rise in in equipment revenues in the business market and revenues from the recently acquired home security line of business also contributed to the upside.
Voice service (local and long distance) revenues were CAD 281 million ($222.2 million), down 11.1%. Other service and equipment revenues were CAD 98 million ($77.5 million), up 6.5%. Adjusted EBITDA of CAD 457 million ($361.4 million) increased 3.7% from the prior-year quarter figure. Adjusted EBITDA margin was 29.7% compared with 30.1% in the year-ago quarter. Wireline capital expenditures declined 1.5% year over year to CAD 468 million ($370.1 million). During the quarter, the company continued to connect more homes and businesses directly to its fiberoptic network.
Cash Flow & Liquidity
For the first quarter, free cash flow increased 104.1% year over year to CAD 443 million ($350.4 million), due to lower cash taxes, decline in capital expenditures and higher EBITDA. As of Mar 31, the company’s long-term debt was CAD 13,785 million ($10,682.7 million).
2018 Outlook
TELUS updated its consolidated financial targets for 2018 to reflect the adoption of IFRS 15. The company projects an increase in revenues to the tune of 4-6% on CAD 13.4 billion. Adjusted EBITDA is expected to increase 3-6% on CAD 5 billion. IFRS earnings per share are expected to increase up to 6% on CAD 2.63. Capital expenditures for 2018 are expected to be approximately CAD 2.85 billion.
CAD 1 = USD 0.790918 (Period average from Jan 1, 2018 to Mar 31, 2018)
CAD 1 = USD 0.774954 (As on Mar 31, 2018)
How Have Estimates Been Moving Since Then?
In the past month, investors have witnessed a downward trend in fresh estimates. There have been two revisions lower for the current quarter.
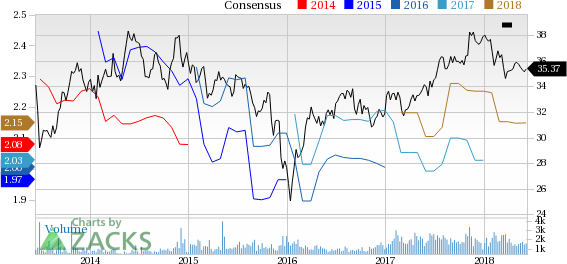
TELUS Corporation Price and Consensus
TELUS Corporation Price and Consensus | TELUS Corporation Quote
VGM Scores
At this time, TU has a nice Growth Score of B, a grade with the same score on the momentum front. Following the exact same course, the stock was allocated a grade of B on the value side, putting it in the second quintile for this investment strategy.
Overall, the stock has an aggregate VGM Score of B. If you aren't focused on one strategy, this score is the one you should be interested in.
Based on our scores, the stock is equally suitable for value, growth and momentum investors.
Outlook
Estimates have been broadly trending downward for the stock and the magnitude of these revisions indicates a downward shift. Notably, TU has a Zacks Rank #3 (Hold). We expect an in-line return from the stock in the next few months.
Want the latest recommendations from Zacks Investment Research? Today, you can download 7 Best Stocks for the Next 30 Days. Click to get this free report
TELUS Corporation (TU) : Free Stock Analysis Report
To read this article on Zacks.com click here.
Zacks Investment Research
