
 Yahoo Finance
 Should You Be Tempted To Sell Axfood AB (publ) (STO:AXFO) Because Of Its P/E Ratio?

This article is for investors who would like to improve their understanding of price to earnings ratios (P/E ratios). We'll show how you can use Axfood AB (publ)'s (STO:AXFO) P/E ratio to inform your assessment of the investment opportunity. Looking at earnings over the last twelve months, Axfood has a P/E ratio of 22.75. That means that at current prices, buyers pay SEK22.75 for every SEK1 in trailing yearly profits.
See our latest analysis for Axfood
How Do I Calculate Axfood's Price To Earnings Ratio?
The formula for price to earnings is:
Price to Earnings Ratio = Price per Share ÷ Earnings per Share (EPS)
Or for Axfood:
P/E of 22.75 = SEK179.05 ÷ SEK7.87 (Based on the year to December 2019.)
Is A High P/E Ratio Good?
A higher P/E ratio means that buyers have to pay a higher price for each SEK1 the company has earned over the last year. That is not a good or a bad thing per se, but a high P/E does imply buyers are optimistic about the future.
Does Axfood Have A Relatively High Or Low P/E For Its Industry?
One good way to get a quick read on what market participants expect of a company is to look at its P/E ratio. You can see in the image below that the average P/E (18.7) for companies in the consumer retailing industry is lower than Axfood's P/E.
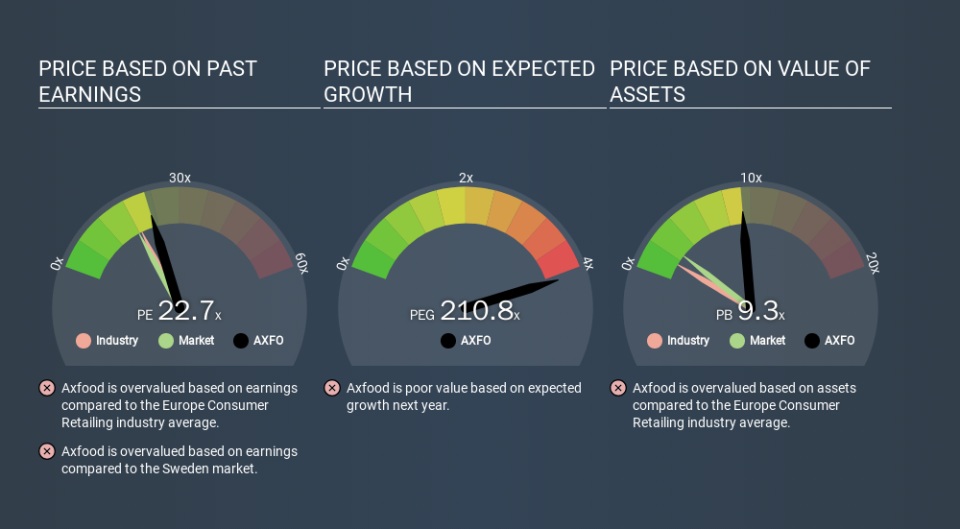
Axfood's P/E tells us that market participants think the company will perform better than its industry peers, going forward. Clearly the market expects growth, but it isn't guaranteed. So further research is always essential. I often monitor director buying and selling.
How Growth Rates Impact P/E Ratios
Probably the most important factor in determining what P/E a company trades on is the earnings growth. That's because companies that grow earnings per share quickly will rapidly increase the 'E' in the equation. And in that case, the P/E ratio itself will drop rather quickly. A lower P/E should indicate the stock is cheap relative to others -- and that may attract buyers.
Axfood saw earnings per share improve by -6.2% last year. And its annual EPS growth rate over 5 years is 8.6%.
Don't Forget: The P/E Does Not Account For Debt or Bank Deposits
One drawback of using a P/E ratio is that it considers market capitalization, but not the balance sheet. That means it doesn't take debt or cash into account. The exact same company would hypothetically deserve a higher P/E ratio if it had a strong balance sheet, than if it had a weak one with lots of debt, because a cashed up company can spend on growth.
Such spending might be good or bad, overall, but the key point here is that you need to look at debt to understand the P/E ratio in context.
Axfood's Balance Sheet
Axfood has net cash of kr377m. That should lead to a higher P/E than if it did have debt, because its strong balance sheets gives it more options.
The Bottom Line On Axfood's P/E Ratio
Axfood's P/E is 22.7 which is above average (17.8) in its market. EPS was up modestly better over the last twelve months. And the healthy balance sheet means the company can sustain growth while the P/E suggests shareholders think it will.
Investors should be looking to buy stocks that the market is wrong about. If the reality for a company is better than it expects, you can make money by buying and holding for the long term. So this free visualization of the analyst consensus on future earnings could help you make the right decision about whether to buy, sell, or hold.
Of course you might be able to find a better stock than Axfood. So you may wish to see this free collection of other companies that have grown earnings strongly.
If you spot an error that warrants correction, please contact the editor at editorial-team@simplywallst.com. This article by Simply Wall St is general in nature. It does not constitute a recommendation to buy or sell any stock, and does not take account of your objectives, or your financial situation. Simply Wall St has no position in the stocks mentioned.
We aim to bring you long-term focused research analysis driven by fundamental data. Note that our analysis may not factor in the latest price-sensitive company announcements or qualitative material. Thank you for reading.
