
 Yahoo Finance
 Should You Be Tempted To Sell Deutsche Börse AG (ETR:DB1) Because Of Its P/E Ratio?

The goal of this article is to teach you how to use price to earnings ratios (P/E ratios). To keep it practical, we'll show how Deutsche Börse AG's (ETR:DB1) P/E ratio could help you assess the value on offer. Based on the last twelve months, Deutsche Börse's P/E ratio is 25.77. That is equivalent to an earnings yield of about 3.9%.
Check out our latest analysis for Deutsche Börse
How Do I Calculate Deutsche Börse's Price To Earnings Ratio?
The formula for P/E is:
Price to Earnings Ratio = Share Price ÷ Earnings per Share (EPS)
Or for Deutsche Börse:
P/E of 25.77 = €127.2 ÷ €4.94 (Based on the year to June 2019.)
Is A High P/E Ratio Good?
A higher P/E ratio means that buyers have to pay a higher price for each €1 the company has earned over the last year. That isn't necessarily good or bad, but a high P/E implies relatively high expectations of what a company can achieve in the future.
Does Deutsche Börse Have A Relatively High Or Low P/E For Its Industry?
We can get an indication of market expectations by looking at the P/E ratio. The image below shows that Deutsche Börse has a P/E ratio that is roughly in line with the capital markets industry average (24.5).
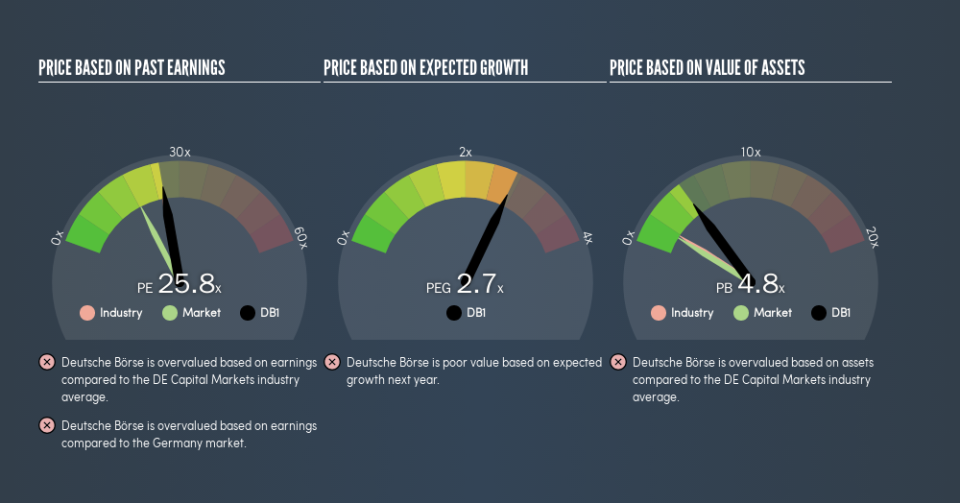
That indicates that the market expects Deutsche Börse will perform roughly in line with other companies in its industry. The company could surprise by performing better than average, in the future. Checking factors such as director buying and selling. could help you form your own view on if that will happen.
How Growth Rates Impact P/E Ratios
Probably the most important factor in determining what P/E a company trades on is the earnings growth. If earnings are growing quickly, then the 'E' in the equation will increase faster than it would otherwise. Therefore, even if you pay a high multiple of earnings now, that multiple will become lower in the future. And as that P/E ratio drops, the company will look cheap, unless its share price increases.
Deutsche Börse increased earnings per share by 4.8% last year. And earnings per share have improved by 9.6% annually, over the last five years.
Don't Forget: The P/E Does Not Account For Debt or Bank Deposits
The 'Price' in P/E reflects the market capitalization of the company. So it won't reflect the advantage of cash, or disadvantage of debt. Hypothetically, a company could reduce its future P/E ratio by spending its cash (or taking on debt) to achieve higher earnings.
Such spending might be good or bad, overall, but the key point here is that you need to look at debt to understand the P/E ratio in context.
So What Does Deutsche Börse's Balance Sheet Tell Us?
Net debt totals just 5.8% of Deutsche Börse's market cap. It would probably trade on a higher P/E ratio if it had a lot of cash, but I doubt it is having a big impact.
The Bottom Line On Deutsche Börse's P/E Ratio
Deutsche Börse has a P/E of 25.8. That's higher than the average in its market, which is 18.2. With debt at prudent levels and improving earnings, it's fair to say the market expects steady progress in the future.
Investors have an opportunity when market expectations about a stock are wrong. People often underestimate remarkable growth -- so investors can make money when fast growth is not fully appreciated. So this free visualization of the analyst consensus on future earnings could help you make the right decision about whether to buy, sell, or hold.
Of course, you might find a fantastic investment by looking at a few good candidates. So take a peek at this free list of companies with modest (or no) debt, trading on a P/E below 20.
We aim to bring you long-term focused research analysis driven by fundamental data. Note that our analysis may not factor in the latest price-sensitive company announcements or qualitative material.
If you spot an error that warrants correction, please contact the editor at editorial-team@simplywallst.com. This article by Simply Wall St is general in nature. It does not constitute a recommendation to buy or sell any stock, and does not take account of your objectives, or your financial situation. Simply Wall St has no position in the stocks mentioned. Thank you for reading.
