
 Yahoo Finance
 Should You Be Tempted To Sell Getlink SE (EPA:GET) Because Of Its P/E Ratio?

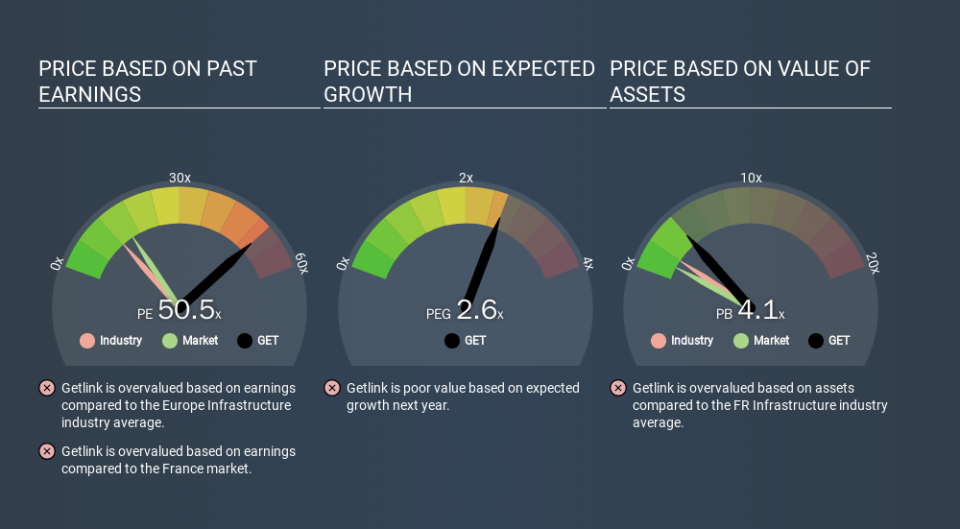
Today, we'll introduce the concept of the P/E ratio for those who are learning about investing. We'll show how you can use Getlink SE's (EPA:GET) P/E ratio to inform your assessment of the investment opportunity. Looking at earnings over the last twelve months, Getlink has a P/E ratio of 50.49. In other words, at today's prices, investors are paying €50.49 for every €1 in prior year profit.
Check out our latest analysis for Getlink
How Do I Calculate A Price To Earnings Ratio?
The formula for P/E is:
Price to Earnings Ratio = Share Price ÷ Earnings per Share (EPS)
Or for Getlink:
P/E of 50.49 = €12.470 ÷ €0.247 (Based on the year to December 2019.)
(Note: the above calculation results may not be precise due to rounding.)
Is A High Price-to-Earnings Ratio Good?
A higher P/E ratio means that buyers have to pay a higher price for each €1 the company has earned over the last year. That is not a good or a bad thing per se, but a high P/E does imply buyers are optimistic about the future.
How Does Getlink's P/E Ratio Compare To Its Peers?
The P/E ratio essentially measures market expectations of a company. You can see in the image below that the average P/E (11.7) for companies in the infrastructure industry is a lot lower than Getlink's P/E.
Getlink's P/E tells us that market participants think the company will perform better than its industry peers, going forward. Shareholders are clearly optimistic, but the future is always uncertain. So investors should delve deeper. I like to check if company insiders have been buying or selling.
How Growth Rates Impact P/E Ratios
Companies that shrink earnings per share quickly will rapidly decrease the 'E' in the equation. That means unless the share price falls, the P/E will increase in a few years. So while a stock may look cheap based on past earnings, it could be expensive based on future earnings.
Most would be impressed by Getlink earnings growth of 13% in the last year. And it has bolstered its earnings per share by 14% per year over the last five years. So one might expect an above average P/E ratio. Unfortunately, earnings per share are down 1.0% a year, over 3 years.
A Limitation: P/E Ratios Ignore Debt and Cash In The Bank
The 'Price' in P/E reflects the market capitalization of the company. So it won't reflect the advantage of cash, or disadvantage of debt. Hypothetically, a company could reduce its future P/E ratio by spending its cash (or taking on debt) to achieve higher earnings.
Spending on growth might be good or bad a few years later, but the point is that the P/E ratio does not account for the option (or lack thereof).
How Does Getlink's Debt Impact Its P/E Ratio?
Getlink has net debt worth 82% of its market capitalization. This is enough debt that you'd have to make some adjustments before using the P/E ratio to compare it to a company with net cash.
The Bottom Line On Getlink's P/E Ratio
With a P/E ratio of 50.5, Getlink is expected to grow earnings very strongly in the years to come. While the meaningful level of debt does limit its options, it has achieved solid growth over the last year. But if growth falters, the relatively high P/E ratio may prove to be unjustified.
Investors have an opportunity when market expectations about a stock are wrong. If the reality for a company is better than it expects, you can make money by buying and holding for the long term. So this free visual report on analyst forecasts could hold the key to an excellent investment decision.
Of course, you might find a fantastic investment by looking at a few good candidates. So take a peek at this free list of companies with modest (or no) debt, trading on a P/E below 20.
If you spot an error that warrants correction, please contact the editor at editorial-team@simplywallst.com. This article by Simply Wall St is general in nature. It does not constitute a recommendation to buy or sell any stock, and does not take account of your objectives, or your financial situation. Simply Wall St has no position in the stocks mentioned.
We aim to bring you long-term focused research analysis driven by fundamental data. Note that our analysis may not factor in the latest price-sensitive company announcements or qualitative material. Thank you for reading.
