
 Yahoo Finance
 Should You Be Tempted To Sell Illinois Tool Works Inc. (NYSE:ITW) Because Of Its P/E Ratio?

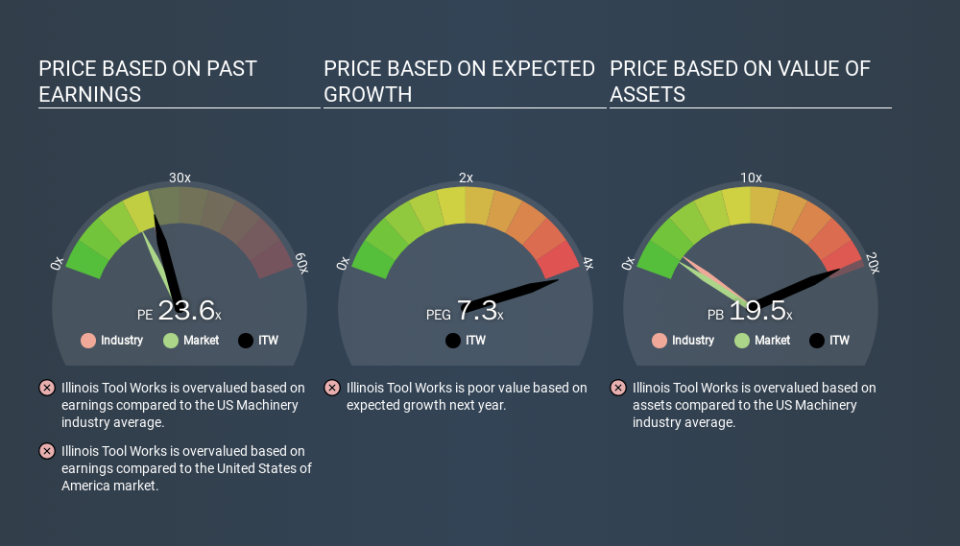
This article is for investors who would like to improve their understanding of price to earnings ratios (P/E ratios). We'll show how you can use Illinois Tool Works Inc.'s (NYSE:ITW) P/E ratio to inform your assessment of the investment opportunity. Based on the last twelve months, Illinois Tool Works's P/E ratio is 23.55. That is equivalent to an earnings yield of about 4.2%.
View our latest analysis for Illinois Tool Works
How Do I Calculate Illinois Tool Works's Price To Earnings Ratio?
The formula for price to earnings is:
Price to Earnings Ratio = Share Price ÷ Earnings per Share (EPS)
Or for Illinois Tool Works:
P/E of 23.55 = $179.63 ÷ $7.63 (Based on the year to September 2019.)
Is A High P/E Ratio Good?
A higher P/E ratio implies that investors pay a higher price for the earning power of the business. All else being equal, it's better to pay a low price -- but as Warren Buffett said, 'It's far better to buy a wonderful company at a fair price than a fair company at a wonderful price'.
How Does Illinois Tool Works's P/E Ratio Compare To Its Peers?
The P/E ratio essentially measures market expectations of a company. You can see in the image below that the average P/E (22.8) for companies in the machinery industry is roughly the same as Illinois Tool Works's P/E.
Illinois Tool Works's P/E tells us that market participants think its prospects are roughly in line with its industry. If the company has better than average prospects, then the market might be underestimating it. Further research into factors such as insider buying and selling, could help you form your own view on whether that is likely.
How Growth Rates Impact P/E Ratios
Earnings growth rates have a big influence on P/E ratios. Earnings growth means that in the future the 'E' will be higher. That means even if the current P/E is high, it will reduce over time if the share price stays flat. And as that P/E ratio drops, the company will look cheap, unless its share price increases.
Illinois Tool Works increased earnings per share by a whopping 37% last year. And its annual EPS growth rate over 5 years is 11%. I'd therefore be a little surprised if its P/E ratio was not relatively high.
A Limitation: P/E Ratios Ignore Debt and Cash In The Bank
The 'Price' in P/E reflects the market capitalization of the company. That means it doesn't take debt or cash into account. The exact same company would hypothetically deserve a higher P/E ratio if it had a strong balance sheet, than if it had a weak one with lots of debt, because a cashed up company can spend on growth.
Such expenditure might be good or bad, in the long term, but the point here is that the balance sheet is not reflected by this ratio.
Illinois Tool Works's Balance Sheet
Illinois Tool Works's net debt is 10% of its market cap. That's enough debt to impact the P/E ratio a little; so keep it in mind if you're comparing it to companies without debt.
The Verdict On Illinois Tool Works's P/E Ratio
Illinois Tool Works trades on a P/E ratio of 23.6, which is above its market average of 18.9. Its debt levels do not imperil its balance sheet and its EPS growth is very healthy indeed. So to be frank we are not surprised it has a high P/E ratio.
When the market is wrong about a stock, it gives savvy investors an opportunity. If the reality for a company is better than it expects, you can make money by buying and holding for the long term. So this free visual report on analyst forecasts could hold the key to an excellent investment decision.
You might be able to find a better buy than Illinois Tool Works. If you want a selection of possible winners, check out this free list of interesting companies that trade on a P/E below 20 (but have proven they can grow earnings).
If you spot an error that warrants correction, please contact the editor at editorial-team@simplywallst.com. This article by Simply Wall St is general in nature. It does not constitute a recommendation to buy or sell any stock, and does not take account of your objectives, or your financial situation. Simply Wall St has no position in the stocks mentioned.
We aim to bring you long-term focused research analysis driven by fundamental data. Note that our analysis may not factor in the latest price-sensitive company announcements or qualitative material. Thank you for reading.
