
 Yahoo Finance
 Should You Be Tempted To Sell James Halstead plc (LON:JHD) Because Of Its P/E Ratio?

The goal of this article is to teach you how to use price to earnings ratios (P/E ratios). We’ll look at James Halstead plc’s (LON:JHD) P/E ratio and reflect on what it tells us about the company’s share price. James Halstead has a P/E ratio of 24.08, based on the last twelve months. That corresponds to an earnings yield of approximately 4.2%.
See our latest analysis for James Halstead
How Do I Calculate A Price To Earnings Ratio?
The formula for price to earnings is:
Price to Earnings Ratio = Price per Share ÷ Earnings per Share (EPS)
Or for James Halstead:
P/E of 24.08 = £4.25 ÷ £0.18 (Based on the trailing twelve months to June 2018.)
Is A High Price-to-Earnings Ratio Good?
A higher P/E ratio means that buyers have to pay a higher price for each £1 the company has earned over the last year. That is not a good or a bad thing per se, but a high P/E does imply buyers are optimistic about the future.
How Growth Rates Impact P/E Ratios
Probably the most important factor in determining what P/E a company trades on is the earnings growth. That’s because companies that grow earnings per share quickly will rapidly increase the ‘E’ in the equation. Therefore, even if you pay a high multiple of earnings now, that multiple will become lower in the future. A lower P/E should indicate the stock is cheap relative to others — and that may attract buyers.
James Halstead had pretty flat EPS growth in the last year. But EPS is up 4.5% over the last 5 years.
How Does James Halstead’s P/E Ratio Compare To Its Peers?
The P/E ratio indicates whether the market has higher or lower expectations of a company. The image below shows that James Halstead has a higher P/E than the average (13.3) P/E for companies in the building industry.
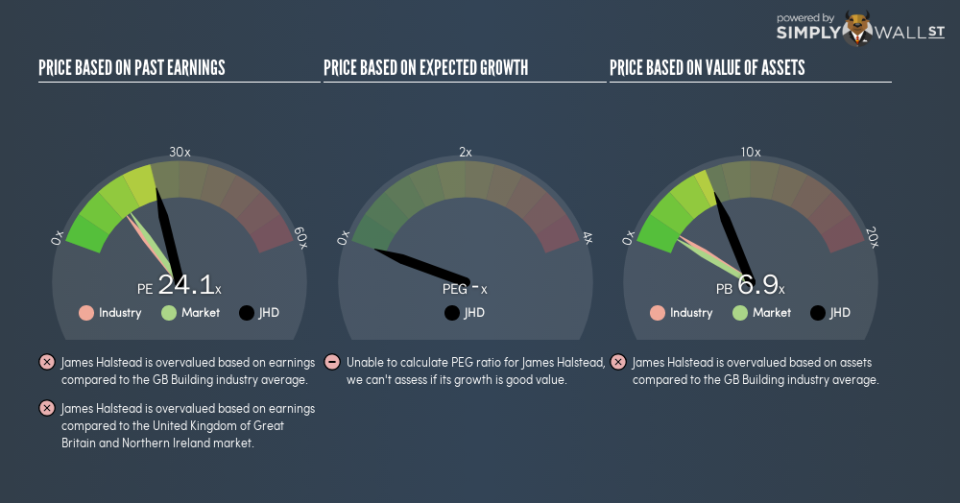
That means that the market expects James Halstead will outperform other companies in its industry. The market is optimistic about the future, but that doesn’t guarantee future growth. So investors should always consider the P/E ratio alongside other factors, such as whether company directors have been buying shares.
Don’t Forget: The P/E Does Not Account For Debt or Bank Deposits
It’s important to note that the P/E ratio considers the market capitalization, not the enterprise value. That means it doesn’t take debt or cash into account. Theoretically, a business can improve its earnings (and produce a lower P/E in the future), by taking on debt (or spending its remaining cash).
Such expenditure might be good or bad, in the long term, but the point here is that the balance sheet is not reflected by this ratio.
Is Debt Impacting James Halstead’s P/E?
Since James Halstead holds net cash of UK£50m, it can spend on growth, justifying a higher P/E ratio than otherwise.
The Bottom Line On James Halstead’s P/E Ratio
James Halstead’s P/E is 24.1 which is above average (14.7) in the GB market. Earnings improved over the last year. And the net cash position provides the company with multiple options. The high P/E suggests the market thinks further growth will come.
Investors should be looking to buy stocks that the market is wrong about. As value investor Benjamin Graham famously said, ‘In the short run, the market is a voting machine but in the long run, it is a weighing machine.’ So this free visual report on analyst forecasts could hold they key to an excellent investment decision.
But note: James Halstead may not be the best stock to buy. So take a peek at this free list of interesting companies with strong recent earnings growth (and a P/E ratio below 20).
To help readers see past the short term volatility of the financial market, we aim to bring you a long-term focused research analysis purely driven by fundamental data. Note that our analysis does not factor in the latest price-sensitive company announcements.
The author is an independent contributor and at the time of publication had no position in the stocks mentioned. For errors that warrant correction please contact the editor at editorial-team@simplywallst.com.
