
 Yahoo Finance
 Should You Be Tempted To Sell JD Sports Fashion plc (LON:JD.) Because Of Its P/E Ratio?

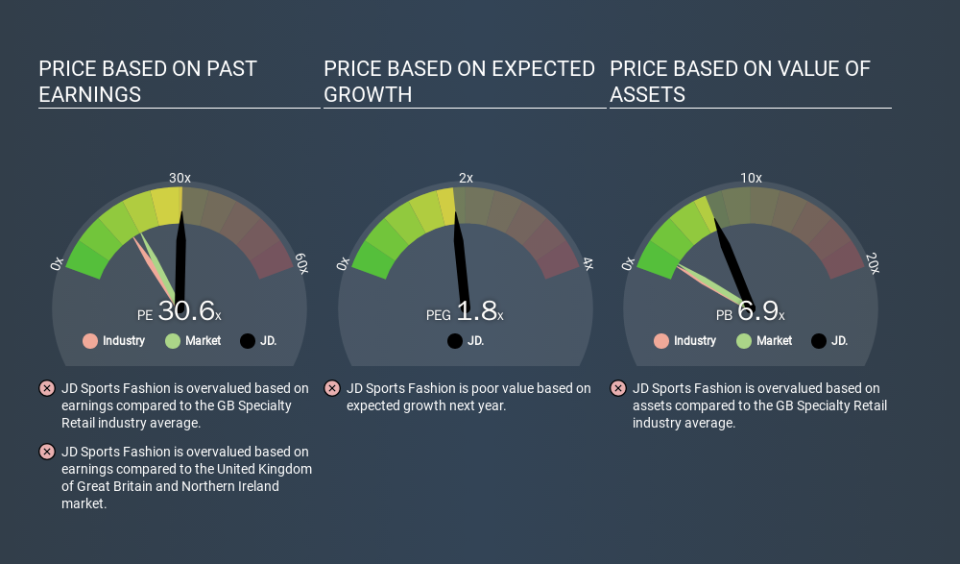
This article is written for those who want to get better at using price to earnings ratios (P/E ratios). We'll apply a basic P/E ratio analysis to JD Sports Fashion plc's (LON:JD.), to help you decide if the stock is worth further research. Based on the last twelve months, JD Sports Fashion's P/E ratio is 30.59. That means that at current prices, buyers pay £30.59 for every £1 in trailing yearly profits.
Check out our latest analysis for JD Sports Fashion
How Do You Calculate A P/E Ratio?
The formula for P/E is:
Price to Earnings Ratio = Price per Share ÷ Earnings per Share (EPS)
Or for JD Sports Fashion:
P/E of 30.59 = £8.11 ÷ £0.27 (Based on the year to August 2019.)
Is A High Price-to-Earnings Ratio Good?
A higher P/E ratio means that investors are paying a higher price for each £1 of company earnings. That isn't a good or a bad thing on its own, but a high P/E means that buyers have a higher opinion of the business's prospects, relative to stocks with a lower P/E.
Does JD Sports Fashion Have A Relatively High Or Low P/E For Its Industry?
One good way to get a quick read on what market participants expect of a company is to look at its P/E ratio. You can see in the image below that the average P/E (15.8) for companies in the specialty retail industry is lower than JD Sports Fashion's P/E.
That means that the market expects JD Sports Fashion will outperform other companies in its industry. Shareholders are clearly optimistic, but the future is always uncertain. So investors should always consider the P/E ratio alongside other factors, such as whether company directors have been buying shares.
How Growth Rates Impact P/E Ratios
Probably the most important factor in determining what P/E a company trades on is the earnings growth. That's because companies that grow earnings per share quickly will rapidly increase the 'E' in the equation. That means even if the current P/E is high, it will reduce over time if the share price stays flat. And as that P/E ratio drops, the company will look cheap, unless its share price increases.
JD Sports Fashion's earnings per share grew by -2.9% in the last twelve months. And its annual EPS growth rate over 5 years is 30%.
A Limitation: P/E Ratios Ignore Debt and Cash In The Bank
Don't forget that the P/E ratio considers market capitalization. So it won't reflect the advantage of cash, or disadvantage of debt. Theoretically, a business can improve its earnings (and produce a lower P/E in the future) by investing in growth. That means taking on debt (or spending its cash).
Such expenditure might be good or bad, in the long term, but the point here is that the balance sheet is not reflected by this ratio.
So What Does JD Sports Fashion's Balance Sheet Tell Us?
JD Sports Fashion has net cash of UK£118m. That should lead to a higher P/E than if it did have debt, because its strong balance sheets gives it more options.
The Verdict On JD Sports Fashion's P/E Ratio
JD Sports Fashion has a P/E of 30.6. That's higher than the average in its market, which is 18.3. Earnings improved over the last year. And the healthy balance sheet means the company can sustain growth while the P/E suggests shareholders think it will.
Investors have an opportunity when market expectations about a stock are wrong. If the reality for a company is better than it expects, you can make money by buying and holding for the long term. So this free visualization of the analyst consensus on future earnings could help you make the right decision about whether to buy, sell, or hold.
Of course, you might find a fantastic investment by looking at a few good candidates. So take a peek at this free list of companies with modest (or no) debt, trading on a P/E below 20.
If you spot an error that warrants correction, please contact the editor at editorial-team@simplywallst.com. This article by Simply Wall St is general in nature. It does not constitute a recommendation to buy or sell any stock, and does not take account of your objectives, or your financial situation. Simply Wall St has no position in the stocks mentioned.
We aim to bring you long-term focused research analysis driven by fundamental data. Note that our analysis may not factor in the latest price-sensitive company announcements or qualitative material. Thank you for reading.
