
 Yahoo Finance
 Should You Be Tempted To Sell L'Oréal S.A. (EPA:OR) Because Of Its P/E Ratio?

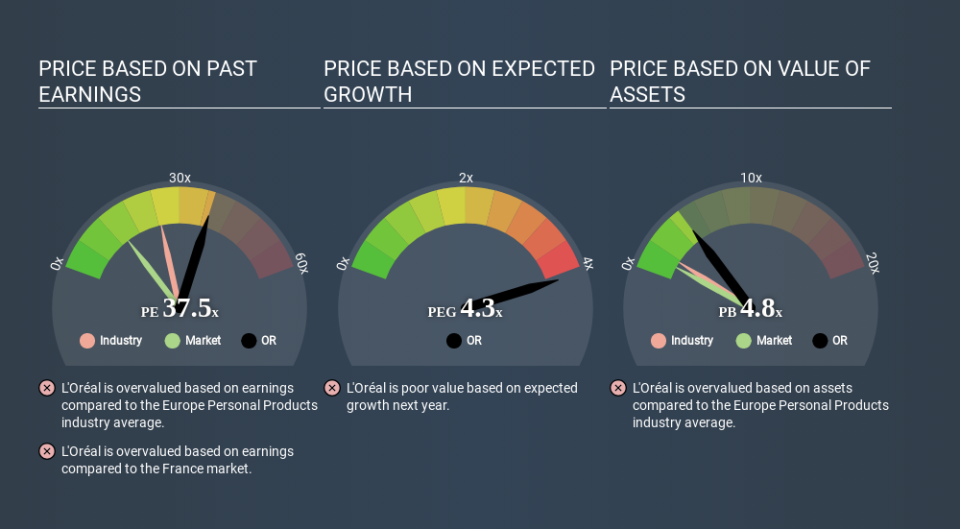
Today, we'll introduce the concept of the P/E ratio for those who are learning about investing. We'll show how you can use L'Oréal S.A.'s (EPA:OR) P/E ratio to inform your assessment of the investment opportunity. L'Oréal has a price to earnings ratio of 37.48, based on the last twelve months. That means that at current prices, buyers pay €37.48 for every €1 in trailing yearly profits.
See our latest analysis for L'Oréal
How Do I Calculate L'Oréal's Price To Earnings Ratio?
The formula for P/E is:
Price to Earnings Ratio = Share Price ÷ Earnings per Share (EPS)
Or for L'Oréal:
P/E of 37.48 = €251.100 ÷ €6.700 (Based on the year to December 2019.)
(Note: the above calculation results may not be precise due to rounding.)
Is A High P/E Ratio Good?
A higher P/E ratio means that buyers have to pay a higher price for each €1 the company has earned over the last year. All else being equal, it's better to pay a low price -- but as Warren Buffett said, 'It's far better to buy a wonderful company at a fair price than a fair company at a wonderful price'.
How Does L'Oréal's P/E Ratio Compare To Its Peers?
The P/E ratio essentially measures market expectations of a company. The image below shows that L'Oréal has a higher P/E than the average (24.8) P/E for companies in the personal products industry.
L'Oréal's P/E tells us that market participants think the company will perform better than its industry peers, going forward. Shareholders are clearly optimistic, but the future is always uncertain. So investors should delve deeper. I like to check if company insiders have been buying or selling.
How Growth Rates Impact P/E Ratios
P/E ratios primarily reflect market expectations around earnings growth rates. If earnings are growing quickly, then the 'E' in the equation will increase faster than it would otherwise. That means even if the current P/E is high, it will reduce over time if the share price stays flat. Then, a lower P/E should attract more buyers, pushing the share price up.
L'Oréal's earnings per share fell by 3.8% in the last twelve months. But over the longer term (5 years) earnings per share have increased by 6.9%.
Don't Forget: The P/E Does Not Account For Debt or Bank Deposits
It's important to note that the P/E ratio considers the market capitalization, not the enterprise value. Thus, the metric does not reflect cash or debt held by the company. Theoretically, a business can improve its earnings (and produce a lower P/E in the future) by investing in growth. That means taking on debt (or spending its cash).
Such expenditure might be good or bad, in the long term, but the point here is that the balance sheet is not reflected by this ratio.
So What Does L'Oréal's Balance Sheet Tell Us?
The extra options and safety that comes with L'Oréal's €4.5b net cash position means that it deserves a higher P/E than it would if it had a lot of net debt.
The Verdict On L'Oréal's P/E Ratio
L'Oréal's P/E is 37.5 which is above average (14.0) in its market. The recent drop in earnings per share might keep value investors away, but the healthy balance sheet means the company retains the potential for future growth. If this growth fails to materialise, the current high P/E could prove to be temporary, as the share price falls.
When the market is wrong about a stock, it gives savvy investors an opportunity. People often underestimate remarkable growth -- so investors can make money when fast growth is not fully appreciated. So this free visual report on analyst forecasts could hold the key to an excellent investment decision.
Of course you might be able to find a better stock than L'Oréal. So you may wish to see this free collection of other companies that have grown earnings strongly.
Love or hate this article? Concerned about the content? Get in touch with us directly. Alternatively, email editorial-team@simplywallst.com.
This article by Simply Wall St is general in nature. It does not constitute a recommendation to buy or sell any stock, and does not take account of your objectives, or your financial situation. We aim to bring you long-term focused analysis driven by fundamental data. Note that our analysis may not factor in the latest price-sensitive company announcements or qualitative material. Simply Wall St has no position in any stocks mentioned. Thank you for reading.
