
 Yahoo Finance
 Should You Be Tempted To Sell PerkinElmer, Inc. (NYSE:PKI) Because Of Its P/E Ratio?

Want to participate in a short research study? Help shape the future of investing tools and you could win a $250 gift card!
The goal of this article is to teach you how to use price to earnings ratios (P/E ratios). To keep it practical, we'll show how PerkinElmer, Inc.'s (NYSE:PKI) P/E ratio could help you assess the value on offer. PerkinElmer has a P/E ratio of 42.48, based on the last twelve months. That corresponds to an earnings yield of approximately 2.4%.
See our latest analysis for PerkinElmer
How Do You Calculate PerkinElmer's P/E Ratio?
The formula for P/E is:
Price to Earnings Ratio = Price per Share ÷ Earnings per Share (EPS)
Or for PerkinElmer:
P/E of 42.48 = $94.88 ÷ $2.23 (Based on the trailing twelve months to March 2019.)
Is A High P/E Ratio Good?
A higher P/E ratio means that buyers have to pay a higher price for each $1 the company has earned over the last year. That is not a good or a bad thing per se, but a high P/E does imply buyers are optimistic about the future.
How Growth Rates Impact P/E Ratios
P/E ratios primarily reflect market expectations around earnings growth rates. That's because companies that grow earnings per share quickly will rapidly increase the 'E' in the equation. That means even if the current P/E is high, it will reduce over time if the share price stays flat. And as that P/E ratio drops, the company will look cheap, unless its share price increases.
PerkinElmer's earnings made like a rocket, taking off 67% last year. Having said that, if we look back three years, EPS growth has averaged a comparatively less impressive 9.5%.
Does PerkinElmer Have A Relatively High Or Low P/E For Its Industry?
We can get an indication of market expectations by looking at the P/E ratio. You can see in the image below that the average P/E (35.1) for companies in the life sciences industry is lower than PerkinElmer's P/E.
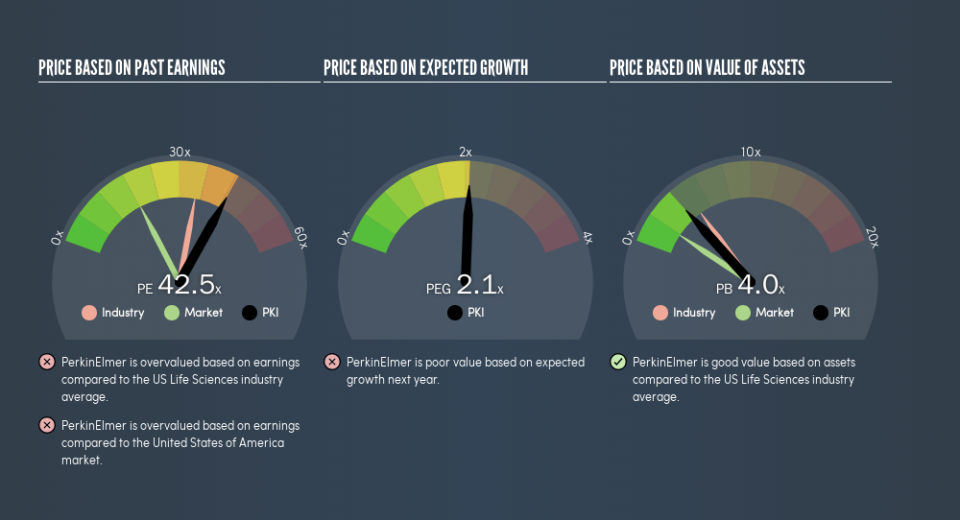
Its relatively high P/E ratio indicates that PerkinElmer shareholders think it will perform better than other companies in its industry classification. Shareholders are clearly optimistic, but the future is always uncertain. So further research is always essential. I often monitor director buying and selling.
Don't Forget: The P/E Does Not Account For Debt or Bank Deposits
It's important to note that the P/E ratio considers the market capitalization, not the enterprise value. In other words, it does not consider any debt or cash that the company may have on the balance sheet. In theory, a company can lower its future P/E ratio by using cash or debt to invest in growth.
Such expenditure might be good or bad, in the long term, but the point here is that the balance sheet is not reflected by this ratio.
Is Debt Impacting PerkinElmer's P/E?
PerkinElmer's net debt is 18% of its market cap. This could bring some additional risk, and reduce the number of investment options for management; worth remembering if you compare its P/E to businesses without debt.
The Verdict On PerkinElmer's P/E Ratio
PerkinElmer trades on a P/E ratio of 42.5, which is above the US market average of 18.1. While the company does use modest debt, its recent earnings growth is superb. So to be frank we are not surprised it has a high P/E ratio.
Investors have an opportunity when market expectations about a stock are wrong. If the reality for a company is better than it expects, you can make money by buying and holding for the long term. So this free report on the analyst consensus forecasts could help you make a master move on this stock.
You might be able to find a better buy than PerkinElmer. If you want a selection of possible winners, check out this free list of interesting companies that trade on a P/E below 20 (but have proven they can grow earnings).
We aim to bring you long-term focused research analysis driven by fundamental data. Note that our analysis may not factor in the latest price-sensitive company announcements or qualitative material.
If you spot an error that warrants correction, please contact the editor at editorial-team@simplywallst.com. This article by Simply Wall St is general in nature. It does not constitute a recommendation to buy or sell any stock, and does not take account of your objectives, or your financial situation. Simply Wall St has no position in the stocks mentioned. Thank you for reading.
