
 Yahoo Finance
 Should You Be Tempted To Sell Pets at Home Group Plc (LON:PETS) Because Of Its P/E Ratio?

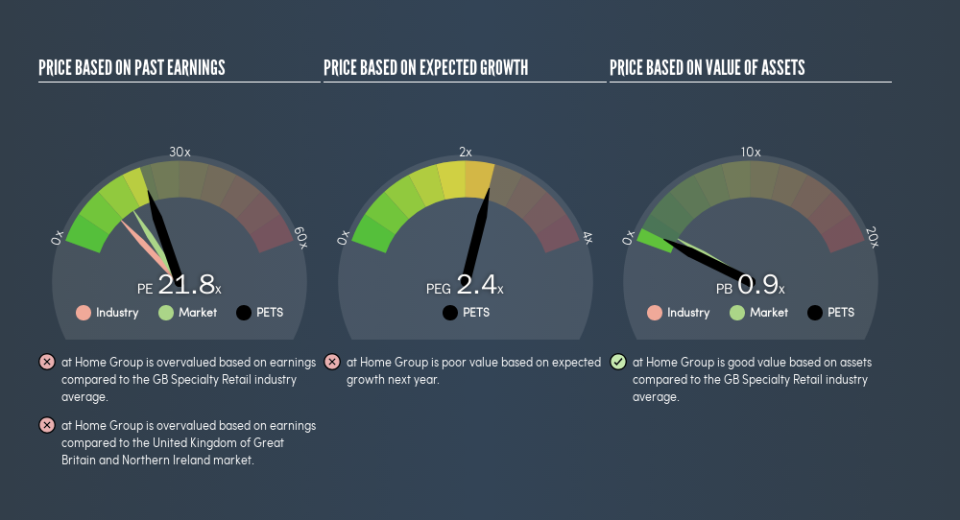
This article is for investors who would like to improve their understanding of price to earnings ratios (P/E ratios). We’ll show how you can use Pets at Home Group Plc’s (LON:PETS) P/E ratio to inform your assessment of the investment opportunity. at Home Group has a P/E ratio of 21.84, based on the last twelve months. That means that at current prices, buyers pay £21.84 for every £1 in trailing yearly profits.
Check out our latest analysis for at Home Group
How Do I Calculate A Price To Earnings Ratio?
The formula for P/E is:
Price to Earnings Ratio = Price per Share ÷ Earnings per Share (EPS)
Or for at Home Group:
P/E of 21.84 = £1.6 ÷ £0.073 (Based on the trailing twelve months to October 2018.)
Is A High P/E Ratio Good?
A higher P/E ratio means that investors are paying a higher price for each £1 of company earnings. That isn’t necessarily good or bad, but a high P/E implies relatively high expectations of what a company can achieve in the future.
How Growth Rates Impact P/E Ratios
If earnings fall then in the future the ‘E’ will be lower. That means unless the share price falls, the P/E will increase in a few years. A higher P/E should indicate the stock is expensive relative to others — and that may encourage shareholders to sell.
at Home Group shrunk earnings per share by 49% over the last year. And it has shrunk its earnings per share by 112% per year over the last five years. This might lead to muted expectations.
How Does at Home Group’s P/E Ratio Compare To Its Peers?
The P/E ratio indicates whether the market has higher or lower expectations of a company. As you can see below, at Home Group has a higher P/E than the average company (10.9) in the specialty retail industry.
That means that the market expects at Home Group will outperform other companies in its industry. Shareholders are clearly optimistic, but the future is always uncertain. So investors should always consider the P/E ratio alongside other factors, such as whether company directors have been buying shares.
A Limitation: P/E Ratios Ignore Debt and Cash In The Bank
Don’t forget that the P/E ratio considers market capitalization. Thus, the metric does not reflect cash or debt held by the company. In theory, a company can lower its future P/E ratio by using cash or debt to invest in growth.
Such spending might be good or bad, overall, but the key point here is that you need to look at debt to understand the P/E ratio in context.
How Does at Home Group’s Debt Impact Its P/E Ratio?
at Home Group’s net debt is 16% of its market cap. That’s enough debt to impact the P/E ratio a little; so keep it in mind if you’re comparing it to companies without debt.
The Verdict On at Home Group’s P/E Ratio
at Home Group’s P/E is 21.8 which is above average (16) in the GB market. With some debt but no EPS growth last year, the market has high expectations of future profits.
When the market is wrong about a stock, it gives savvy investors an opportunity. People often underestimate remarkable growth — so investors can make money when fast growth is not fully appreciated. So this free visualization of the analyst consensus on future earnings could help you make the right decision about whether to buy, sell, or hold.
Of course, you might find a fantastic investment by looking at a few good candidates. So take a peek at this free list of companies with modest (or no) debt, trading on a P/E below 20.
We aim to bring you long-term focused research analysis driven by fundamental data. Note that our analysis may not factor in the latest price-sensitive company announcements or qualitative material.
If you spot an error that warrants correction, please contact the editor at editorial-team@simplywallst.com. This article by Simply Wall St is general in nature. It does not constitute a recommendation to buy or sell any stock, and does not take account of your objectives, or your financial situation. Simply Wall St has no position in the stocks mentioned. Thank you for reading.
