
 Yahoo Finance
 Should You Be Tempted To Sell Pfeiffer Vacuum Technology AG (ETR:PFV) Because Of Its P/E Ratio?

This article is written for those who want to get better at using price to earnings ratios (P/E ratios). We'll show how you can use Pfeiffer Vacuum Technology AG's (ETR:PFV) P/E ratio to inform your assessment of the investment opportunity. Looking at earnings over the last twelve months, Pfeiffer Vacuum Technology has a P/E ratio of 25.17. That corresponds to an earnings yield of approximately 4.0%.
See our latest analysis for Pfeiffer Vacuum Technology
How Do I Calculate A Price To Earnings Ratio?
The formula for price to earnings is:
Price to Earnings Ratio = Share Price ÷ Earnings per Share (EPS)
Or for Pfeiffer Vacuum Technology:
P/E of 25.17 = €147.5 ÷ €5.86 (Based on the trailing twelve months to June 2019.)
Is A High Price-to-Earnings Ratio Good?
A higher P/E ratio means that buyers have to pay a higher price for each €1 the company has earned over the last year. That isn't necessarily good or bad, but a high P/E implies relatively high expectations of what a company can achieve in the future.
How Does Pfeiffer Vacuum Technology's P/E Ratio Compare To Its Peers?
The P/E ratio indicates whether the market has higher or lower expectations of a company. The image below shows that Pfeiffer Vacuum Technology has a higher P/E than the average (14.6) P/E for companies in the machinery industry.
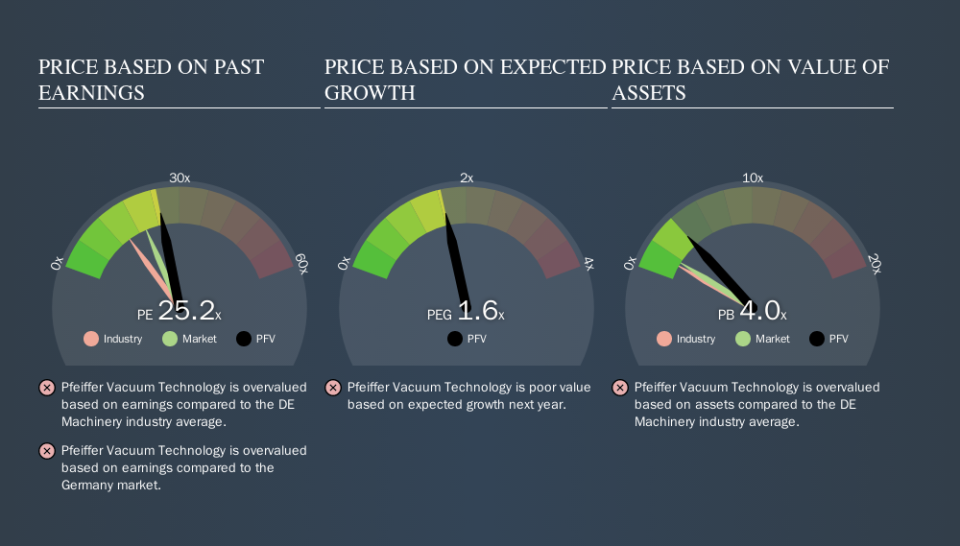
That means that the market expects Pfeiffer Vacuum Technology will outperform other companies in its industry. Shareholders are clearly optimistic, but the future is always uncertain. So investors should delve deeper. I like to check if company insiders have been buying or selling.
How Growth Rates Impact P/E Ratios
P/E ratios primarily reflect market expectations around earnings growth rates. Earnings growth means that in the future the 'E' will be higher. That means unless the share price increases, the P/E will reduce in a few years. Then, a lower P/E should attract more buyers, pushing the share price up.
Pfeiffer Vacuum Technology shrunk earnings per share by 9.7% last year. But it has grown its earnings per share by 11% per year over the last five years.
A Limitation: P/E Ratios Ignore Debt and Cash In The Bank
The 'Price' in P/E reflects the market capitalization of the company. That means it doesn't take debt or cash into account. The exact same company would hypothetically deserve a higher P/E ratio if it had a strong balance sheet, than if it had a weak one with lots of debt, because a cashed up company can spend on growth.
Such expenditure might be good or bad, in the long term, but the point here is that the balance sheet is not reflected by this ratio.
Is Debt Impacting Pfeiffer Vacuum Technology's P/E?
The extra options and safety that comes with Pfeiffer Vacuum Technology's €34m net cash position means that it deserves a higher P/E than it would if it had a lot of net debt.
The Bottom Line On Pfeiffer Vacuum Technology's P/E Ratio
Pfeiffer Vacuum Technology has a P/E of 25.2. That's higher than the average in its market, which is 20.1. The recent drop in earnings per share might keep value investors away, but the healthy balance sheet means the company retains potential for future growth. If fails to eventuate, the current high P/E could prove to be temporary, as the share price falls.
Investors have an opportunity when market expectations about a stock are wrong. If the reality for a company is better than it expects, you can make money by buying and holding for the long term. So this free visualization of the analyst consensus on future earnings could help you make the right decision about whether to buy, sell, or hold.
You might be able to find a better buy than Pfeiffer Vacuum Technology. If you want a selection of possible winners, check out this free list of interesting companies that trade on a P/E below 20 (but have proven they can grow earnings).
We aim to bring you long-term focused research analysis driven by fundamental data. Note that our analysis may not factor in the latest price-sensitive company announcements or qualitative material.
If you spot an error that warrants correction, please contact the editor at editorial-team@simplywallst.com. This article by Simply Wall St is general in nature. It does not constitute a recommendation to buy or sell any stock, and does not take account of your objectives, or your financial situation. Simply Wall St has no position in the stocks mentioned. Thank you for reading.
