
 Yahoo Finance
 Should You Be Tempted To Sell Xpediator Plc (LON:XPD) Because Of Its PE Ratio?

This article is intended for those of you who are at the beginning of your investing journey and want to learn about the link between company’s fundamentals and stock market performance.
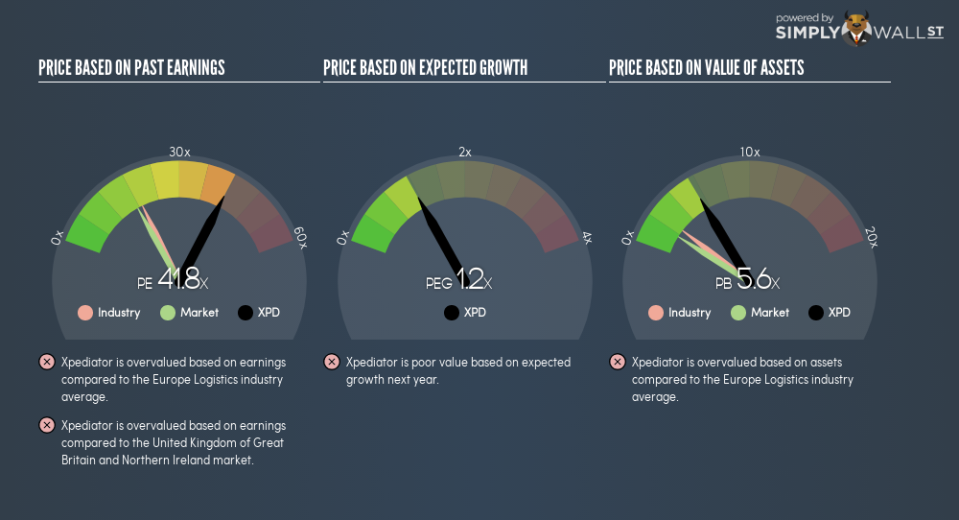
Xpediator Plc (LON:XPD) trades with a trailing P/E of 41.8, which is higher than the industry average of 18.7. Though this might seem to be a negative, you might change your mind after I explain the assumptions behind the P/E ratio. Today, I will break down what the P/E ratio is, how to interpret it and what to watch out for.
See our latest analysis for Xpediator
Breaking down the P/E ratio
The P/E ratio is a popular ratio used in relative valuation since earnings power is a key driver of investment value. By comparing a stock’s price per share to its earnings per share, we are able to see how much investors are paying for each dollar of the company’s earnings.
P/E Calculation for XPD
Price-Earnings Ratio = Price per share ÷ Earnings per share
XPD Price-Earnings Ratio = £0.69 ÷ £0.0164 = 41.8x
On its own, the P/E ratio doesn’t tell you much; however, it becomes extremely useful when you compare it with other similar companies. We preferably want to compare the stock’s P/E ratio to the average of companies that have similar features to XPD, such as capital structure and profitability. One way of gathering a peer group is to use firms in the same industry, which is what I’ll do. Since XPD’s P/E of 41.8 is higher than its industry peers (18.7), it means that investors are paying more for each dollar of XPD’s earnings. Since the Logistics sector in GB is relatively small, I’ve included similar companies in the wider region in order to get a better idea of the multiple, which is a median of profitable companies of companies such as Royal Mail, and . You could also say that the market is suggesting that XPD is a stronger business than the average comparable company.
Assumptions to be aware of
However, it is important to note that our examination of the stock is based on certain assumptions. The first is that our “similar companies” are actually similar to XPD. If not, the difference in P/E might be a result of other factors. For example, Xpediator Plc could be growing more quickly than the companies we’re comparing it with. In that case it would deserve a higher P/E ratio. Of course, it is possible that the stocks we are comparing with XPD are not fairly valued. Thus while we might conclude that it is richly valued relative to its peers, that could be explained by the peer group being undervalued.
What this means for you:
Since you may have already conducted your due diligence on XPD, the overvaluation of the stock may mean it is a good time to reduce your current holdings. But at the end of the day, keep in mind that relative valuation relies heavily on critical assumptions I’ve outlined above. Remember that basing your investment decision off one metric alone is certainly not sufficient. There are many things I have not taken into account in this article and the PE ratio is very one-dimensional. If you have not done so already, I urge you to complete your research by taking a look at the following:
Future Outlook: What are well-informed industry analysts predicting for XPD’s future growth? Take a look at our free research report of analyst consensus for XPD’s outlook.
Financial Health: Are XPD’s operations financially sustainable? Balance sheets can be hard to analyze, which is why we’ve done it for you. Check out our financial health checks here.
Other High-Performing Stocks: Are there other stocks that provide better prospects with proven track records? Explore our free list of these great stocks here.
To help readers see past the short term volatility of the financial market, we aim to bring you a long-term focused research analysis purely driven by fundamental data. Note that our analysis does not factor in the latest price-sensitive company announcements.
The author is an independent contributor and at the time of publication had no position in the stocks mentioned. For errors that warrant correction please contact the editor at editorial-team@simplywallst.com.
