
 Yahoo Finance
 Tenaga Nasional Berhad Full Year 2023 Earnings: Revenues Beat Expectations, EPS Lags
Tenaga Nasional Berhad (KLSE:TENAGA) Full Year 2023 Results
Key Financial Results
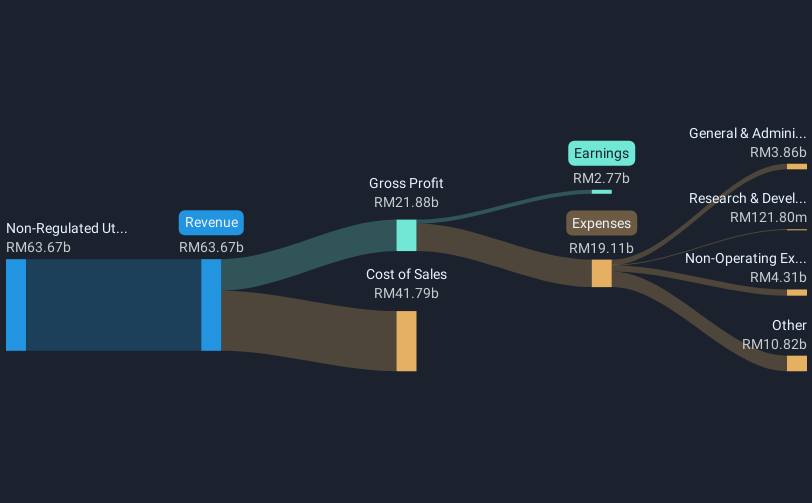
Revenue: RM63.7b (down 13% from FY 2022).
Net income: RM2.77b (down 20% from FY 2022).
Profit margin: 4.4% (down from 4.7% in FY 2022). The decrease in margin was driven by lower revenue.
EPS: RM0.48 (down from RM0.60 in FY 2022).
All figures shown in the chart above are for the trailing 12 month (TTM) period
Tenaga Nasional Berhad Revenues Beat Expectations, EPS Falls Short
Revenue exceeded analyst estimates by 11%. Earnings per share (EPS) missed analyst estimates by 27%.
In the last 12 months, the only revenue segment was Non-Regulated Utility contributing RM63.7b. Notably, cost of sales worth RM41.8b amounted to 66% of total revenue thereby underscoring the impact on earnings. The largest operating expense was Depreciation & Amortisation (D&A) costs, amounting to RM11.3b (59% of total expenses). Explore how TENAGA's revenue and expenses shape its earnings.
Looking ahead, revenue is expected to decline by 1.0% p.a. on average during the next 3 years, while revenues in the Electric Utilities industry in Asia are expected to grow by 3.7%.
Performance of the market in Malaysia.
The company's shares are up 2.2% from a week ago.
Risk Analysis
Don't forget that there may still be risks. For instance, we've identified 2 warning signs for Tenaga Nasional Berhad (1 is significant) you should be aware of.
Have feedback on this article? Concerned about the content? Get in touch with us directly. Alternatively, email editorial-team (at) simplywallst.com.
This article by Simply Wall St is general in nature. We provide commentary based on historical data and analyst forecasts only using an unbiased methodology and our articles are not intended to be financial advice. It does not constitute a recommendation to buy or sell any stock, and does not take account of your objectives, or your financial situation. We aim to bring you long-term focused analysis driven by fundamental data. Note that our analysis may not factor in the latest price-sensitive company announcements or qualitative material. Simply Wall St has no position in any stocks mentioned.
