
 Yahoo Finance
 Are Teradyne, Inc.’s (NASDAQ:TER) High Returns Really That Great?

Today we'll look at Teradyne, Inc. (NASDAQ:TER) and reflect on its potential as an investment. Specifically, we're going to calculate its Return On Capital Employed (ROCE), in the hopes of getting some insight into the business.
First of all, we'll work out how to calculate ROCE. Second, we'll look at its ROCE compared to similar companies. Finally, we'll look at how its current liabilities affect its ROCE.
Understanding Return On Capital Employed (ROCE)
ROCE is a measure of a company's yearly pre-tax profit (its return), relative to the capital employed in the business. Generally speaking a higher ROCE is better. Ultimately, it is a useful but imperfect metric. Author Edwin Whiting says to be careful when comparing the ROCE of different businesses, since 'No two businesses are exactly alike.'
How Do You Calculate Return On Capital Employed?
Analysts use this formula to calculate return on capital employed:
Return on Capital Employed = Earnings Before Interest and Tax (EBIT) ÷ (Total Assets - Current Liabilities)
Or for Teradyne:
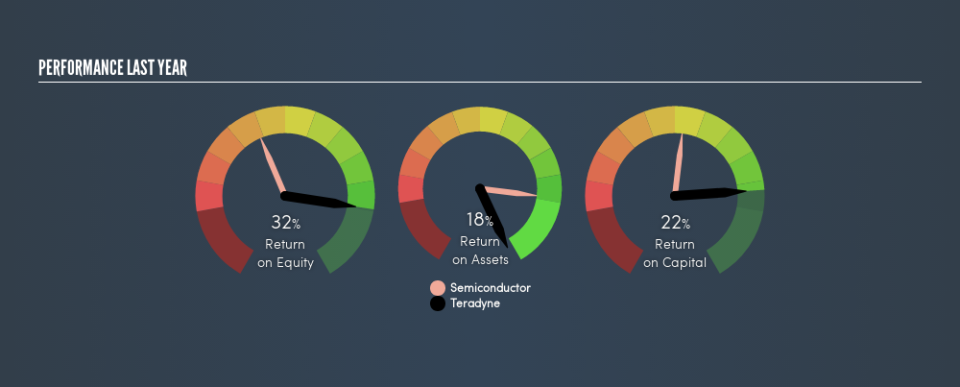
0.22 = US$492m ÷ (US$2.7b - US$467m) (Based on the trailing twelve months to June 2019.)
Therefore, Teradyne has an ROCE of 22%.
Check out our latest analysis for Teradyne
Is Teradyne's ROCE Good?
ROCE can be useful when making comparisons, such as between similar companies. In our analysis, Teradyne's ROCE is meaningfully higher than the 10% average in the Semiconductor industry. We would consider this a positive, as it suggests it is using capital more effectively than other similar companies. Regardless of the industry comparison, in absolute terms, Teradyne's ROCE currently appears to be excellent.
Our data shows that Teradyne currently has an ROCE of 22%, compared to its ROCE of 13% 3 years ago. This makes us think the business might be improving. You can click on the image below to see (in greater detail) how Teradyne's past growth compares to other companies.
When considering this metric, keep in mind that it is backwards looking, and not necessarily predictive. ROCE can be deceptive for cyclical businesses, as returns can look incredible in boom times, and terribly low in downturns. ROCE is only a point-in-time measure. What happens in the future is pretty important for investors, so we have prepared a free report on analyst forecasts for Teradyne.
How Teradyne's Current Liabilities Impact Its ROCE
Liabilities, such as supplier bills and bank overdrafts, are referred to as current liabilities if they need to be paid within 12 months. Due to the way ROCE is calculated, a high level of current liabilities makes a company look as though it has less capital employed, and thus can (sometimes unfairly) boost the ROCE. To check the impact of this, we calculate if a company has high current liabilities relative to its total assets.
Teradyne has total liabilities of US$467m and total assets of US$2.7b. As a result, its current liabilities are equal to approximately 17% of its total assets. The fairly low level of current liabilities won't have much impact on the already great ROCE.
Our Take On Teradyne's ROCE
Low current liabilities and high ROCE is a good combination, making Teradyne look quite interesting. Teradyne looks strong on this analysis, but there are plenty of other companies that could be a good opportunity . Here is a free list of companies growing earnings rapidly.
If you are like me, then you will not want to miss this free list of growing companies that insiders are buying.
We aim to bring you long-term focused research analysis driven by fundamental data. Note that our analysis may not factor in the latest price-sensitive company announcements or qualitative material.
If you spot an error that warrants correction, please contact the editor at editorial-team@simplywallst.com. This article by Simply Wall St is general in nature. It does not constitute a recommendation to buy or sell any stock, and does not take account of your objectives, or your financial situation. Simply Wall St has no position in the stocks mentioned. Thank you for reading.
