
 Yahoo Finance
 Is Tesco PLC’s (LON:TSCO) Balance Sheet Strong Enough To Weather A Storm?

There are a number of reasons that attract investors towards large-cap companies such as Tesco PLC (LON:TSCO), with a market cap of UK£25.40b. Big corporations are much sought after by risk-averse investors who find diversified revenue streams and strong capital returns attractive. However, the key to extending previous success is in the health of the company’s financials. I will provide an overview of Tesco’s financial liquidity and leverage to give you an idea of Tesco’s position to take advantage of potential acquisitions or comfortably endure future downturns. Remember this is a very top-level look that focuses exclusively on financial health, so I recommend a deeper analysis into TSCO here. Check out our latest analysis for Tesco
How does TSCO’s operating cash flow stack up against its debt?
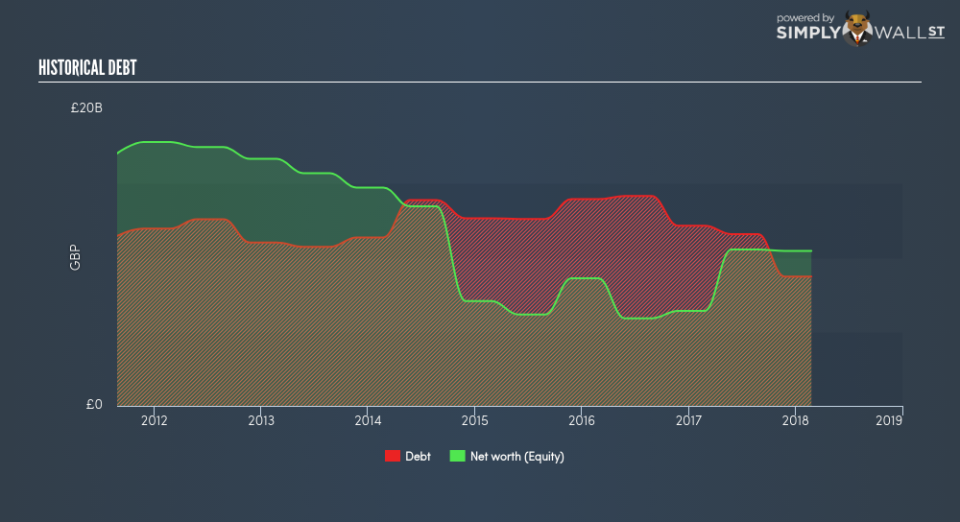
TSCO’s debt levels have fallen from UK£12.15b to UK£8.73b over the last 12 months – this includes both the current and long-term debt. With this debt payback, TSCO’s cash and short-term investments stands at UK£3.78b , ready to deploy into the business. Additionally, TSCO has generated cash from operations of UK£2.78b in the last twelve months, resulting in an operating cash to total debt ratio of 31.88%, indicating that TSCO’s debt is appropriately covered by operating cash. This ratio can also be interpreted as a measure of efficiency as an alternative to return on assets. In TSCO’s case, it is able to generate 0.32x cash from its debt capital.
Can TSCO pay its short-term liabilities?
With current liabilities at UK£19.24b, it appears that the company has not maintained a sufficient level of current assets to meet its obligations, with the current ratio last standing at 0.71x, which is below the prudent industry ratio of 3x.
Does TSCO face the risk of succumbing to its debt-load?
TSCO is a relatively highly levered company with a debt-to-equity of 83.44%. This is common amongst large-cap companies because debt can often be a less expensive alternative to equity due to tax deductibility of interest payments. Since large-caps are seen as safer than their smaller constituents, they tend to enjoy lower cost of capital. We can assess the sustainability of TSCO’s debt levels to the test by looking at how well interest payments are covered by earnings. Preferably, earnings before interest and tax (EBIT) should be at least three times as large as net interest. In TSCO’s case, the ratio of 4.6x suggests that interest is appropriately covered. Large-cap investments like TSCO are often believed to be a safe investment due to their ability to pump out ample earnings multiple times its interest payments.
Next Steps:
Although TSCO’s debt level is towards the higher end of the spectrum, its cash flow coverage seems adequate to meet debt obligations which means its debt is being efficiently utilised. But, its low liquidity raises concerns over whether current asset management practices are properly implemented for the large-cap. This is only a rough assessment of financial health, and I’m sure TSCO has company-specific issues impacting its capital structure decisions. You should continue to research Tesco to get a better picture of the stock by looking at:
Future Outlook: What are well-informed industry analysts predicting for TSCO’s future growth? Take a look at our free research report of analyst consensus for TSCO’s outlook.
Valuation: What is TSCO worth today? Is the stock undervalued, even when its growth outlook is factored into its intrinsic value? The intrinsic value infographic in our free research report helps visualize whether TSCO is currently mispriced by the market.
Other High-Performing Stocks: Are there other stocks that provide better prospects with proven track records? Explore our free list of these great stocks here.
To help readers see pass the short term volatility of the financial market, we aim to bring you a long-term focused research analysis purely driven by fundamental data. Note that our analysis does not factor in the latest price sensitive company announcements.
The author is an independent contributor and at the time of publication had no position in the stocks mentioned.
