
 Yahoo Finance
 Should Textainer Group Holdings Limited’s (NYSE:TGH) Weak Investment Returns Worry You?

Want to participate in a short research study? Help shape the future of investing tools and you could win a $250 gift card!
Today we'll look at Textainer Group Holdings Limited (NYSE:TGH) and reflect on its potential as an investment. Specifically, we're going to calculate its Return On Capital Employed (ROCE), in the hopes of getting some insight into the business.
First up, we'll look at what ROCE is and how we calculate it. Then we'll compare its ROCE to similar companies. Then we'll determine how its current liabilities are affecting its ROCE.
Understanding Return On Capital Employed (ROCE)
ROCE is a measure of a company's yearly pre-tax profit (its return), relative to the capital employed in the business. All else being equal, a better business will have a higher ROCE. Overall, it is a valuable metric that has its flaws. Author Edwin Whiting says to be careful when comparing the ROCE of different businesses, since 'No two businesses are exactly alike.'
So, How Do We Calculate ROCE?
Analysts use this formula to calculate return on capital employed:
Return on Capital Employed = Earnings Before Interest and Tax (EBIT) ÷ (Total Assets - Current Liabilities)
Or for Textainer Group Holdings:
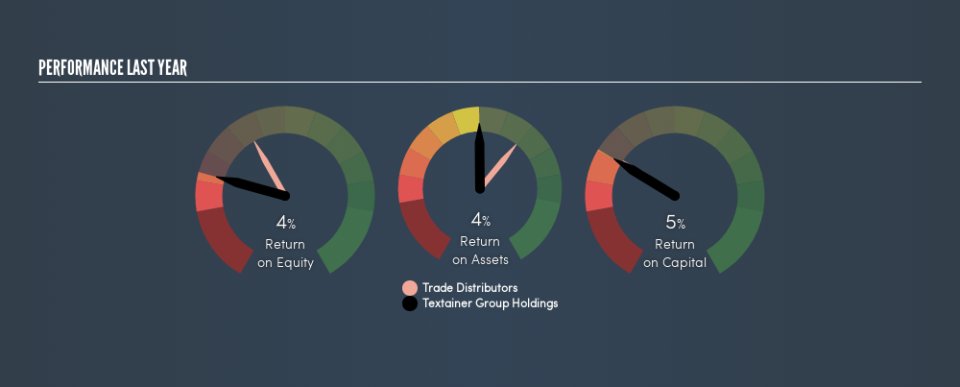
0.05 = US$223m ÷ (US$4.8b - US$322m) (Based on the trailing twelve months to March 2019.)
So, Textainer Group Holdings has an ROCE of 5.0%.
See our latest analysis for Textainer Group Holdings
Does Textainer Group Holdings Have A Good ROCE?
One way to assess ROCE is to compare similar companies. We can see Textainer Group Holdings's ROCE is meaningfully below the Trade Distributors industry average of 8.3%. This performance could be negative if sustained, as it suggests the business may underperform its industry. Putting aside Textainer Group Holdings's performance relative to its industry, its ROCE in absolute terms is poor - considering the risk of owning stocks compared to government bonds. There are potentially more appealing investments elsewhere.
When considering this metric, keep in mind that it is backwards looking, and not necessarily predictive. ROCE can be deceptive for cyclical businesses, as returns can look incredible in boom times, and terribly low in downturns. ROCE is, after all, simply a snap shot of a single year. Future performance is what matters, and you can see analyst predictions in our free report on analyst forecasts for the company.
Textainer Group Holdings's Current Liabilities And Their Impact On Its ROCE
Current liabilities include invoices, such as supplier payments, short-term debt, or a tax bill, that need to be paid within 12 months. The ROCE equation subtracts current liabilities from capital employed, so a company with a lot of current liabilities appears to have less capital employed, and a higher ROCE than otherwise. To check the impact of this, we calculate if a company has high current liabilities relative to its total assets.
Textainer Group Holdings has total liabilities of US$322m and total assets of US$4.8b. Therefore its current liabilities are equivalent to approximately 6.7% of its total assets. Textainer Group Holdings has very few current liabilities, which have a minimal effect on its already low ROCE.
Our Take On Textainer Group Holdings's ROCE
Still, investors could probably find more attractive prospects with better performance out there. But note: make sure you look for a great company, not just the first idea you come across. So take a peek at this free list of interesting companies with strong recent earnings growth (and a P/E ratio below 20).
For those who like to find winning investments this free list of growing companies with recent insider purchasing, could be just the ticket.
We aim to bring you long-term focused research analysis driven by fundamental data. Note that our analysis may not factor in the latest price-sensitive company announcements or qualitative material.
If you spot an error that warrants correction, please contact the editor at editorial-team@simplywallst.com. This article by Simply Wall St is general in nature. It does not constitute a recommendation to buy or sell any stock, and does not take account of your objectives, or your financial situation. Simply Wall St has no position in the stocks mentioned. Thank you for reading.
