
 Yahoo Finance
 Is Textron Inc. (NYSE:TXT) Creating Value For Shareholders?

Today we are going to look at Textron Inc. (NYSE:TXT) to see whether it might be an attractive investment prospect. Specifically, we're going to calculate its Return On Capital Employed (ROCE), in the hopes of getting some insight into the business.
First, we'll go over how we calculate ROCE. Then we'll compare its ROCE to similar companies. Then we'll determine how its current liabilities are affecting its ROCE.
What is Return On Capital Employed (ROCE)?
ROCE measures the amount of pre-tax profits a company can generate from the capital employed in its business. All else being equal, a better business will have a higher ROCE. Overall, it is a valuable metric that has its flaws. Author Edwin Whiting says to be careful when comparing the ROCE of different businesses, since 'No two businesses are exactly alike.
So, How Do We Calculate ROCE?
The formula for calculating the return on capital employed is:
Return on Capital Employed = Earnings Before Interest and Tax (EBIT) ÷ (Total Assets - Current Liabilities)
Or for Textron:
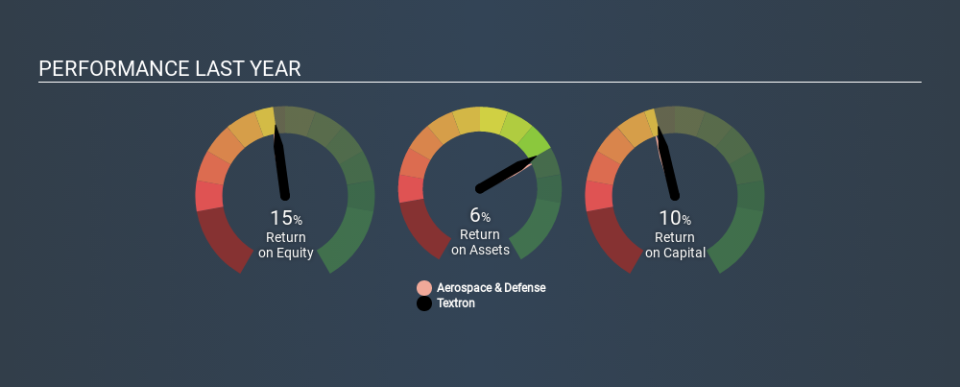
0.10 = US$1.2b ÷ (US$15b - US$3.8b) (Based on the trailing twelve months to January 2020.)
Therefore, Textron has an ROCE of 10%.
Check out our latest analysis for Textron
Does Textron Have A Good ROCE?
When making comparisons between similar businesses, investors may find ROCE useful. It appears that Textron's ROCE is fairly close to the Aerospace & Defense industry average of 11%. Separate from Textron's performance relative to its industry, its ROCE in absolute terms looks satisfactory, and it may be worth researching in more depth.
You can see in the image below how Textron's ROCE compares to its industry. Click to see more on past growth.
It is important to remember that ROCE shows past performance, and is not necessarily predictive. ROCE can be deceptive for cyclical businesses, as returns can look incredible in boom times, and terribly low in downturns. This is because ROCE only looks at one year, instead of considering returns across a whole cycle. Since the future is so important for investors, you should check out our free report on analyst forecasts for Textron.
What Are Current Liabilities, And How Do They Affect Textron's ROCE?
Current liabilities include invoices, such as supplier payments, short-term debt, or a tax bill, that need to be paid within 12 months. Due to the way the ROCE equation works, having large bills due in the near term can make it look as though a company has less capital employed, and thus a higher ROCE than usual. To check the impact of this, we calculate if a company has high current liabilities relative to its total assets.
Textron has total assets of US$15b and current liabilities of US$3.8b. Therefore its current liabilities are equivalent to approximately 26% of its total assets. Low current liabilities are not boosting the ROCE too much.
Our Take On Textron's ROCE
This is good to see, and with a sound ROCE, Textron could be worth a closer look. Textron looks strong on this analysis, but there are plenty of other companies that could be a good opportunity . Here is a free list of companies growing earnings rapidly.
If you like to buy stocks alongside management, then you might just love this free list of companies. (Hint: insiders have been buying them).
If you spot an error that warrants correction, please contact the editor at editorial-team@simplywallst.com. This article by Simply Wall St is general in nature. It does not constitute a recommendation to buy or sell any stock, and does not take account of your objectives, or your financial situation. Simply Wall St has no position in the stocks mentioned.
We aim to bring you long-term focused research analysis driven by fundamental data. Note that our analysis may not factor in the latest price-sensitive company announcements or qualitative material. Thank you for reading.
