
 Yahoo Finance
 TGS-NOPEC Geophysical Company ASA (OB:TGS): Has Recent Earnings Growth Beaten Long-Term Trend?

When TGS-NOPEC Geophysical Company ASA’s (OB:TGS) announced its latest earnings (31 March 2018), I wanted to understand how these figures stacked up against its past performance. The two benchmarks I used were TGS-NOPEC Geophysical’s average earnings over the past couple of years, and its industry performance. These are useful yardsticks to help me gauge whether or not TGS actually performed well. Below is a quick commentary on how I see TGS has performed. See our latest analysis for TGS-NOPEC Geophysical
Were TGS’s earnings stronger than its past performances and the industry?
To account for any quarterly or half-yearly updates, I use the ‘latest twelve-month’ data, which annualizes the most recent half-year data, or in some cases, the latest annual report is already the most recent financial year data. This enables me to assess different stocks on a similar basis, using the latest information. For TGS-NOPEC Geophysical, its latest earnings (trailing twelve month) is US$70.38M, which compared to the prior year’s level, has moved up by 40.81%. Given that these figures may be relatively short-term, I have estimated an annualized five-year value for TGS-NOPEC Geophysical’s net income, which stands at US$144.56M This suggests that, while earnings growth from last year was positive, over the long run, TGS-NOPEC Geophysical’s earnings have been declining on average.
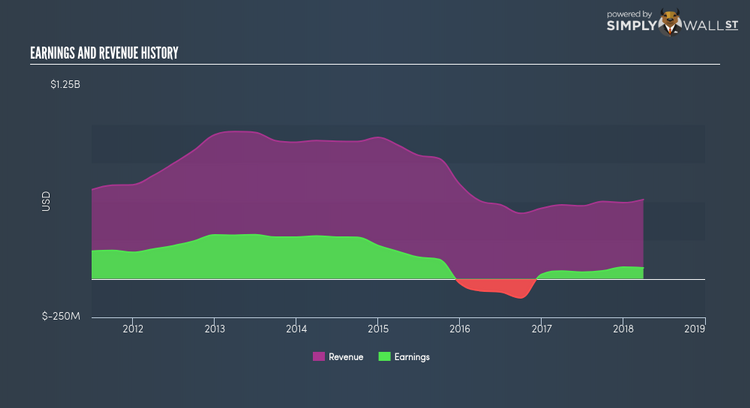
Why is this? Well, let’s take a look at what’s transpiring with margins and if the whole industry is facing the same headwind. Although revenue growth in the last few years, has been negative, earnings growth has been falling by even more, implying that TGS-NOPEC Geophysical has been ramping up its expenses. This harms margins and earnings, and is not a sustainable practice. Looking at growth from a sector-level, the NO energy services industry has been growing its average earnings by double-digit 32.94% over the prior twelve months, . This is a turnaround from a volatile drop of -2.74% in the past few years. This means in the recent industry expansion, TGS-NOPEC Geophysical is capable of leveraging this to its advantage.
What does this mean?
While past data is useful, it doesn’t tell the whole story. Recent positive growth doesn’t necessarily mean it’s onwards and upwards for the company. There may be factors that are affecting the entire industry thus the high industry growth rate over the same time period. You should continue to research TGS-NOPEC Geophysical to get a more holistic view of the stock by looking at:
Future Outlook: What are well-informed industry analysts predicting for TGS’s future growth? Take a look at our free research report of analyst consensus for TGS’s outlook.
Financial Health: Is TGS’s operations financially sustainable? Balance sheets can be hard to analyze, which is why we’ve done it for you. Check out our financial health checks here.
Other High-Performing Stocks: Are there other stocks that provide better prospects with proven track records? Explore our free list of these great stocks here.
NB: Figures in this article are calculated using data from the trailing twelve months from 31 March 2018. This may not be consistent with full year annual report figures.
To help readers see pass the short term volatility of the financial market, we aim to bring you a long-term focused research analysis purely driven by fundamental data. Note that our analysis does not factor in the latest price sensitive company announcements.
The author is an independent contributor and at the time of publication had no position in the stocks mentioned.
