
 Yahoo Finance
 There's Been No Shortage Of Growth Recently For Tonkens Agrar's (ETR:GTK) Returns On Capital
If you're looking for a multi-bagger, there's a few things to keep an eye out for. One common approach is to try and find a company with returns on capital employed (ROCE) that are increasing, in conjunction with a growing amount of capital employed. Basically this means that a company has profitable initiatives that it can continue to reinvest in, which is a trait of a compounding machine. With that in mind, we've noticed some promising trends at Tonkens Agrar (ETR:GTK) so let's look a bit deeper.
Understanding Return On Capital Employed (ROCE)
For those who don't know, ROCE is a measure of a company's yearly pre-tax profit (its return), relative to the capital employed in the business. To calculate this metric for Tonkens Agrar, this is the formula:
Return on Capital Employed = Earnings Before Interest and Tax (EBIT) ÷ (Total Assets - Current Liabilities)
0.092 = €2.3m ÷ (€38m - €13m) (Based on the trailing twelve months to June 2023).
Therefore, Tonkens Agrar has an ROCE of 9.2%. On its own that's a low return on capital but it's in line with the industry's average returns of 9.2%.
See our latest analysis for Tonkens Agrar
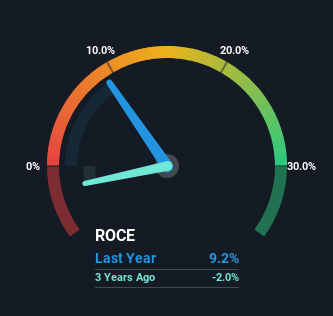
Historical performance is a great place to start when researching a stock so above you can see the gauge for Tonkens Agrar's ROCE against it's prior returns. If you'd like to look at how Tonkens Agrar has performed in the past in other metrics, you can view this free graph of Tonkens Agrar's past earnings, revenue and cash flow.
So How Is Tonkens Agrar's ROCE Trending?
Tonkens Agrar has not disappointed with their ROCE growth. The figures show that over the last five years, ROCE has grown 44% whilst employing roughly the same amount of capital. So it's likely that the business is now reaping the full benefits of its past investments, since the capital employed hasn't changed considerably. On that front, things are looking good so it's worth exploring what management has said about growth plans going forward.
The Bottom Line
In summary, we're delighted to see that Tonkens Agrar has been able to increase efficiencies and earn higher rates of return on the same amount of capital. Investors may not be impressed by the favorable underlying trends yet because over the last five years the stock has only returned 13% to shareholders. So exploring more about this stock could uncover a good opportunity, if the valuation and other metrics stack up.
Tonkens Agrar does have some risks though, and we've spotted 3 warning signs for Tonkens Agrar that you might be interested in.
While Tonkens Agrar may not currently earn the highest returns, we've compiled a list of companies that currently earn more than 25% return on equity. Check out this free list here.
Have feedback on this article? Concerned about the content? Get in touch with us directly. Alternatively, email editorial-team (at) simplywallst.com.
This article by Simply Wall St is general in nature. We provide commentary based on historical data and analyst forecasts only using an unbiased methodology and our articles are not intended to be financial advice. It does not constitute a recommendation to buy or sell any stock, and does not take account of your objectives, or your financial situation. We aim to bring you long-term focused analysis driven by fundamental data. Note that our analysis may not factor in the latest price-sensitive company announcements or qualitative material. Simply Wall St has no position in any stocks mentioned.
