
 Yahoo Finance
 There's Been No Shortage Of Growth Recently For MyHealthChecked's (LON:MHC) Returns On Capital
What are the early trends we should look for to identify a stock that could multiply in value over the long term? Amongst other things, we'll want to see two things; firstly, a growing return on capital employed (ROCE) and secondly, an expansion in the company's amount of capital employed. This shows us that it's a compounding machine, able to continually reinvest its earnings back into the business and generate higher returns. With that in mind, we've noticed some promising trends at MyHealthChecked (LON:MHC) so let's look a bit deeper.
Return On Capital Employed (ROCE): What Is It?
Just to clarify if you're unsure, ROCE is a metric for evaluating how much pre-tax income (in percentage terms) a company earns on the capital invested in its business. To calculate this metric for MyHealthChecked, this is the formula:
Return on Capital Employed = Earnings Before Interest and Tax (EBIT) ÷ (Total Assets - Current Liabilities)
0.14 = UK£1.2m ÷ (UK£10m - UK£1.6m) (Based on the trailing twelve months to June 2023).
Thus, MyHealthChecked has an ROCE of 14%. In absolute terms, that's a satisfactory return, but compared to the Medical Equipment industry average of 8.8% it's much better.
Check out our latest analysis for MyHealthChecked
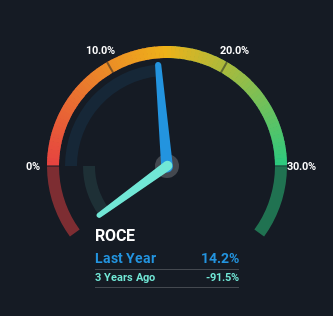
Historical performance is a great place to start when researching a stock so above you can see the gauge for MyHealthChecked's ROCE against it's prior returns. If you'd like to look at how MyHealthChecked has performed in the past in other metrics, you can view this free graph of MyHealthChecked's past earnings, revenue and cash flow.
So How Is MyHealthChecked's ROCE Trending?
MyHealthChecked has recently broken into profitability so their prior investments seem to be paying off. Shareholders would no doubt be pleased with this because the business was loss-making five years ago but is is now generating 14% on its capital. Not only that, but the company is utilizing 398% more capital than before, but that's to be expected from a company trying to break into profitability. We like this trend, because it tells us the company has profitable reinvestment opportunities available to it, and if it continues going forward that can lead to a multi-bagger performance.
In Conclusion...
Long story short, we're delighted to see that MyHealthChecked's reinvestment activities have paid off and the company is now profitable. And since the stock has dived 81% over the last five years, there may be other factors affecting the company's prospects. Still, it's worth doing some further research to see if the trends will continue into the future.
If you want to know some of the risks facing MyHealthChecked we've found 4 warning signs (2 are a bit unpleasant!) that you should be aware of before investing here.
If you want to search for solid companies with great earnings, check out this free list of companies with good balance sheets and impressive returns on equity.
Have feedback on this article? Concerned about the content? Get in touch with us directly. Alternatively, email editorial-team (at) simplywallst.com.
This article by Simply Wall St is general in nature. We provide commentary based on historical data and analyst forecasts only using an unbiased methodology and our articles are not intended to be financial advice. It does not constitute a recommendation to buy or sell any stock, and does not take account of your objectives, or your financial situation. We aim to bring you long-term focused analysis driven by fundamental data. Note that our analysis may not factor in the latest price-sensitive company announcements or qualitative material. Simply Wall St has no position in any stocks mentioned.
