
 Yahoo Finance
 There's Been No Shortage Of Growth Recently For MedNation's (FRA:EIF) Returns On Capital
If you're not sure where to start when looking for the next multi-bagger, there are a few key trends you should keep an eye out for. Typically, we'll want to notice a trend of growing return on capital employed (ROCE) and alongside that, an expanding base of capital employed. If you see this, it typically means it's a company with a great business model and plenty of profitable reinvestment opportunities. So when we looked at MedNation (FRA:EIF) and its trend of ROCE, we really liked what we saw.
Understanding Return On Capital Employed (ROCE)
For those who don't know, ROCE is a measure of a company's yearly pre-tax profit (its return), relative to the capital employed in the business. The formula for this calculation on MedNation is:
Return on Capital Employed = Earnings Before Interest and Tax (EBIT) ÷ (Total Assets - Current Liabilities)
0.019 = €1.2m ÷ (€74m - €10m) (Based on the trailing twelve months to June 2023).
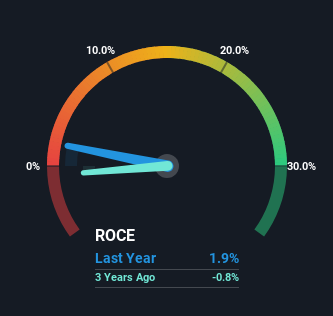
So, MedNation has an ROCE of 1.9%. Ultimately, that's a low return and it under-performs the Healthcare industry average of 6.0%.
See our latest analysis for MedNation
While the past is not representative of the future, it can be helpful to know how a company has performed historically, which is why we have this chart above. If you want to delve into the historical earnings , check out these free graphs detailing revenue and cash flow performance of MedNation.
So How Is MedNation's ROCE Trending?
We're glad to see that ROCE is heading in the right direction, even if it is still low at the moment. The numbers show that in the last five years, the returns generated on capital employed have grown considerably to 1.9%. The amount of capital employed has increased too, by 30%. This can indicate that there's plenty of opportunities to invest capital internally and at ever higher rates, a combination that's common among multi-baggers.
What We Can Learn From MedNation's ROCE
A company that is growing its returns on capital and can consistently reinvest in itself is a highly sought after trait, and that's what MedNation has. Given the stock has declined 52% in the last five years, this could be a good investment if the valuation and other metrics are also appealing. With that in mind, we believe the promising trends warrant this stock for further investigation.
On a final note, we've found 3 warning signs for MedNation that we think you should be aware of.
While MedNation isn't earning the highest return, check out this free list of companies that are earning high returns on equity with solid balance sheets.
Have feedback on this article? Concerned about the content? Get in touch with us directly. Alternatively, email editorial-team (at) simplywallst.com.
This article by Simply Wall St is general in nature. We provide commentary based on historical data and analyst forecasts only using an unbiased methodology and our articles are not intended to be financial advice. It does not constitute a recommendation to buy or sell any stock, and does not take account of your objectives, or your financial situation. We aim to bring you long-term focused analysis driven by fundamental data. Note that our analysis may not factor in the latest price-sensitive company announcements or qualitative material. Simply Wall St has no position in any stocks mentioned.
