
 Yahoo Finance
 There's Been No Shortage Of Growth Recently For Questerre Energy's (TSE:QEC) Returns On Capital
What trends should we look for it we want to identify stocks that can multiply in value over the long term? Typically, we'll want to notice a trend of growing return on capital employed (ROCE) and alongside that, an expanding base of capital employed. Put simply, these types of businesses are compounding machines, meaning they are continually reinvesting their earnings at ever-higher rates of return. Speaking of which, we noticed some great changes in Questerre Energy's (TSE:QEC) returns on capital, so let's have a look.
What Is Return On Capital Employed (ROCE)?
For those that aren't sure what ROCE is, it measures the amount of pre-tax profits a company can generate from the capital employed in its business. The formula for this calculation on Questerre Energy is:
Return on Capital Employed = Earnings Before Interest and Tax (EBIT) ÷ (Total Assets - Current Liabilities)
0.03 = CA$5.7m ÷ (CA$201m - CA$12m) (Based on the trailing twelve months to June 2023).
Therefore, Questerre Energy has an ROCE of 3.0%. In absolute terms, that's a low return and it also under-performs the Oil and Gas industry average of 13%.
See our latest analysis for Questerre Energy
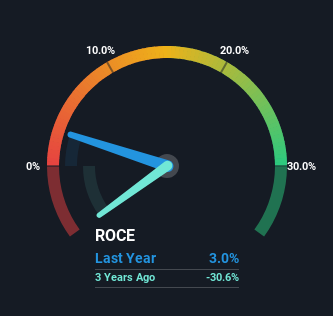
Historical performance is a great place to start when researching a stock so above you can see the gauge for Questerre Energy's ROCE against it's prior returns. If you'd like to look at how Questerre Energy has performed in the past in other metrics, you can view this free graph of past earnings, revenue and cash flow.
What Does the ROCE Trend For Questerre Energy Tell Us?
Questerre Energy has broken into the black (profitability) and we're sure it's a sight for sore eyes. The company was generating losses five years ago, but has managed to turn it around and as we saw earlier is now earning 3.0%, which is always encouraging. Interestingly, the capital employed by the business has remained relatively flat, so these higher returns are either from prior investments paying off or increased efficiencies. So while we're happy that the business is more efficient, just keep in mind that could mean that going forward the business is lacking areas to invest internally for growth. So if you're looking for high growth, you'll want to see a business's capital employed also increasing.
The Key Takeaway
As discussed above, Questerre Energy appears to be getting more proficient at generating returns since capital employed has remained flat but earnings (before interest and tax) are up. Given the stock has declined 56% in the last five years, this could be a good investment if the valuation and other metrics are also appealing. With that in mind, we believe the promising trends warrant this stock for further investigation.
One more thing to note, we've identified 2 warning signs with Questerre Energy and understanding them should be part of your investment process.
For those who like to invest in solid companies, check out this free list of companies with solid balance sheets and high returns on equity.
Have feedback on this article? Concerned about the content? Get in touch with us directly. Alternatively, email editorial-team (at) simplywallst.com.
This article by Simply Wall St is general in nature. We provide commentary based on historical data and analyst forecasts only using an unbiased methodology and our articles are not intended to be financial advice. It does not constitute a recommendation to buy or sell any stock, and does not take account of your objectives, or your financial situation. We aim to bring you long-term focused analysis driven by fundamental data. Note that our analysis may not factor in the latest price-sensitive company announcements or qualitative material. Simply Wall St has no position in any stocks mentioned.
