
 Yahoo Finance
 There's Reason For Concern Over EnSilica plc's (LON:ENSI) Price
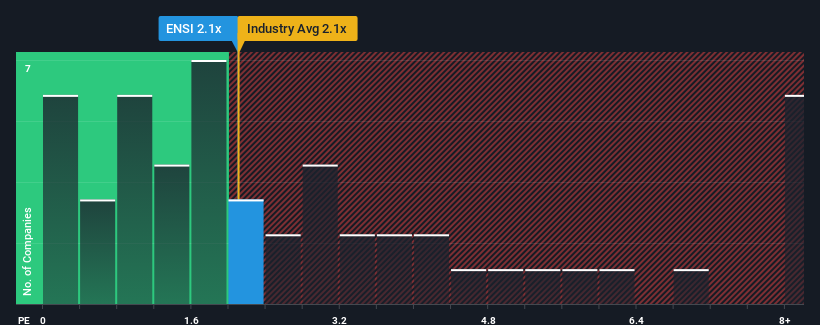
There wouldn't be many who think EnSilica plc's (LON:ENSI) price-to-sales (or "P/S") ratio of 2.1x is worth a mention when the median P/S for the Semiconductor industry in the United Kingdom is similar at about 2.2x. Although, it's not wise to simply ignore the P/S without explanation as investors may be disregarding a distinct opportunity or a costly mistake.
See our latest analysis for EnSilica
How EnSilica Has Been Performing
Recent times haven't been great for EnSilica as its revenue has been rising slower than most other companies. One possibility is that the P/S ratio is moderate because investors think this lacklustre revenue performance will turn around. You'd really hope so, otherwise you're paying a relatively elevated price for a company with this sort of growth profile.
If you'd like to see what analysts are forecasting going forward, you should check out our free report on EnSilica.
Is There Some Revenue Growth Forecasted For EnSilica?
EnSilica's P/S ratio would be typical for a company that's only expected to deliver moderate growth, and importantly, perform in line with the industry.
If we review the last year of revenue growth, the company posted a terrific increase of 34%. The strong recent performance means it was also able to grow revenue by 217% in total over the last three years. So we can start by confirming that the company has done a great job of growing revenue over that time.
Looking ahead now, revenue is anticipated to climb by 12% during the coming year according to the lone analyst following the company. Meanwhile, the rest of the industry is forecast to expand by 21%, which is noticeably more attractive.
In light of this, it's curious that EnSilica's P/S sits in line with the majority of other companies. It seems most investors are ignoring the fairly limited growth expectations and are willing to pay up for exposure to the stock. These shareholders may be setting themselves up for future disappointment if the P/S falls to levels more in line with the growth outlook.
What Does EnSilica's P/S Mean For Investors?
Generally, our preference is to limit the use of the price-to-sales ratio to establishing what the market thinks about the overall health of a company.
Our look at the analysts forecasts of EnSilica's revenue prospects has shown that its inferior revenue outlook isn't negatively impacting its P/S as much as we would have predicted. When we see companies with a relatively weaker revenue outlook compared to the industry, we suspect the share price is at risk of declining, sending the moderate P/S lower. A positive change is needed in order to justify the current price-to-sales ratio.
Before you take the next step, you should know about the 3 warning signs for EnSilica (1 can't be ignored!) that we have uncovered.
It's important to make sure you look for a great company, not just the first idea you come across. So if growing profitability aligns with your idea of a great company, take a peek at this free list of interesting companies with strong recent earnings growth (and a low P/E).
Have feedback on this article? Concerned about the content? Get in touch with us directly. Alternatively, email editorial-team (at) simplywallst.com.
This article by Simply Wall St is general in nature. We provide commentary based on historical data and analyst forecasts only using an unbiased methodology and our articles are not intended to be financial advice. It does not constitute a recommendation to buy or sell any stock, and does not take account of your objectives, or your financial situation. We aim to bring you long-term focused analysis driven by fundamental data. Note that our analysis may not factor in the latest price-sensitive company announcements or qualitative material. Simply Wall St has no position in any stocks mentioned.
