
 Yahoo Finance
 Thermo Fisher Scientific (NYSE:TMO) Has A Pretty Healthy Balance Sheet
Legendary fund manager Li Lu (who Charlie Munger backed) once said, 'The biggest investment risk is not the volatility of prices, but whether you will suffer a permanent loss of capital.' When we think about how risky a company is, we always like to look at its use of debt, since debt overload can lead to ruin. As with many other companies Thermo Fisher Scientific Inc. (NYSE:TMO) makes use of debt. But the more important question is: how much risk is that debt creating?
Why Does Debt Bring Risk?
Debt assists a business until the business has trouble paying it off, either with new capital or with free cash flow. In the worst case scenario, a company can go bankrupt if it cannot pay its creditors. However, a more common (but still painful) scenario is that it has to raise new equity capital at a low price, thus permanently diluting shareholders. Having said that, the most common situation is where a company manages its debt reasonably well - and to its own advantage. The first thing to do when considering how much debt a business uses is to look at its cash and debt together.
View our latest analysis for Thermo Fisher Scientific
What Is Thermo Fisher Scientific's Net Debt?
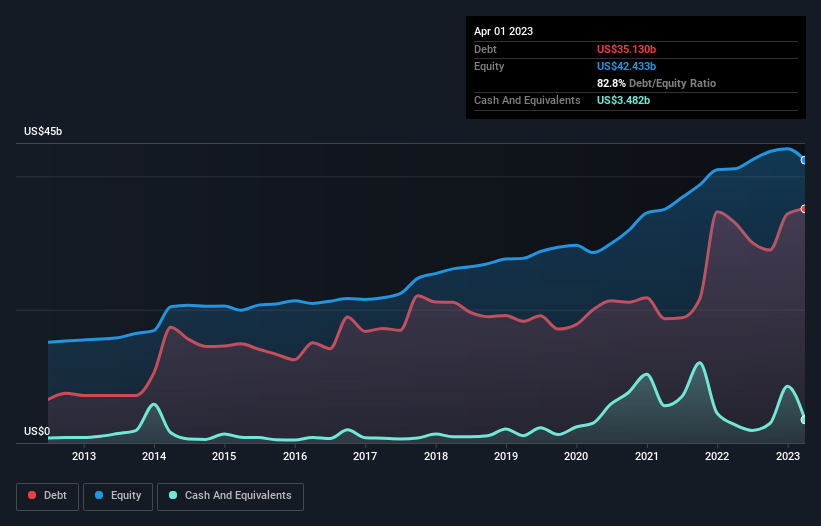
As you can see below, at the end of April 2023, Thermo Fisher Scientific had US$35.1b of debt, up from US$33.1b a year ago. Click the image for more detail. However, because it has a cash reserve of US$3.48b, its net debt is less, at about US$31.6b.
A Look At Thermo Fisher Scientific's Liabilities
We can see from the most recent balance sheet that Thermo Fisher Scientific had liabilities of US$15.9b falling due within a year, and liabilities of US$36.3b due beyond that. Offsetting this, it had US$3.48b in cash and US$9.30b in receivables that were due within 12 months. So it has liabilities totalling US$39.4b more than its cash and near-term receivables, combined.
Given Thermo Fisher Scientific has a humongous market capitalization of US$200.8b, it's hard to believe these liabilities pose much threat. But there are sufficient liabilities that we would certainly recommend shareholders continue to monitor the balance sheet, going forward.
We measure a company's debt load relative to its earnings power by looking at its net debt divided by its earnings before interest, tax, depreciation, and amortization (EBITDA) and by calculating how easily its earnings before interest and tax (EBIT) cover its interest expense (interest cover). The advantage of this approach is that we take into account both the absolute quantum of debt (with net debt to EBITDA) and the actual interest expenses associated with that debt (with its interest cover ratio).
Thermo Fisher Scientific has a debt to EBITDA ratio of 2.9, which signals significant debt, but is still pretty reasonable for most types of business. But its EBIT was about 15.6 times its interest expense, implying the company isn't really paying a high cost to maintain that level of debt. Even were the low cost to prove unsustainable, that is a good sign. Importantly, Thermo Fisher Scientific's EBIT fell a jaw-dropping 26% in the last twelve months. If that earnings trend continues then paying off its debt will be about as easy as herding cats on to a roller coaster. The balance sheet is clearly the area to focus on when you are analysing debt. But ultimately the future profitability of the business will decide if Thermo Fisher Scientific can strengthen its balance sheet over time. So if you want to see what the professionals think, you might find this free report on analyst profit forecasts to be interesting.
Finally, a business needs free cash flow to pay off debt; accounting profits just don't cut it. So we always check how much of that EBIT is translated into free cash flow. During the last three years, Thermo Fisher Scientific produced sturdy free cash flow equating to 75% of its EBIT, about what we'd expect. This free cash flow puts the company in a good position to pay down debt, when appropriate.
Our View
Thermo Fisher Scientific's EBIT growth rate was a real negative on this analysis, although the other factors we considered were considerably better. In particular, we are dazzled with its interest cover. When we consider all the factors mentioned above, we do feel a bit cautious about Thermo Fisher Scientific's use of debt. While debt does have its upside in higher potential returns, we think shareholders should definitely consider how debt levels might make the stock more risky. There's no doubt that we learn most about debt from the balance sheet. But ultimately, every company can contain risks that exist outside of the balance sheet. For instance, we've identified 1 warning sign for Thermo Fisher Scientific that you should be aware of.
Of course, if you're the type of investor who prefers buying stocks without the burden of debt, then don't hesitate to discover our exclusive list of net cash growth stocks, today.
Have feedback on this article? Concerned about the content? Get in touch with us directly. Alternatively, email editorial-team (at) simplywallst.com.
This article by Simply Wall St is general in nature. We provide commentary based on historical data and analyst forecasts only using an unbiased methodology and our articles are not intended to be financial advice. It does not constitute a recommendation to buy or sell any stock, and does not take account of your objectives, or your financial situation. We aim to bring you long-term focused analysis driven by fundamental data. Note that our analysis may not factor in the latest price-sensitive company announcements or qualitative material. Simply Wall St has no position in any stocks mentioned.
Join A Paid User Research Session
You’ll receive a US$30 Amazon Gift card for 1 hour of your time while helping us build better investing tools for the individual investors like yourself. Sign up here
