
 Yahoo Finance
 What We Think Of Hunter Douglas N.V.’s (AMS:HDG) Investment Potential

Today we'll look at Hunter Douglas N.V. (AMS:HDG) and reflect on its potential as an investment. In particular, we'll consider its Return On Capital Employed (ROCE), as that can give us insight into how profitably the company is able to employ capital in its business.
First, we'll go over how we calculate ROCE. Next, we'll compare it to others in its industry. Then we'll determine how its current liabilities are affecting its ROCE.
What is Return On Capital Employed (ROCE)?
ROCE is a metric for evaluating how much pre-tax income (in percentage terms) a company earns on the capital invested in its business. All else being equal, a better business will have a higher ROCE. Overall, it is a valuable metric that has its flaws. Renowned investment researcher Michael Mauboussin has suggested that a high ROCE can indicate that 'one dollar invested in the company generates value of more than one dollar'.
So, How Do We Calculate ROCE?
The formula for calculating the return on capital employed is:
Return on Capital Employed = Earnings Before Interest and Tax (EBIT) ÷ (Total Assets - Current Liabilities)
Or for Hunter Douglas:
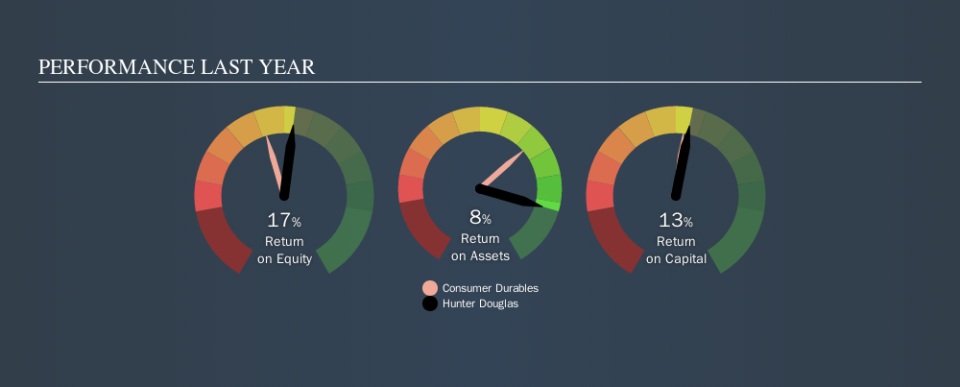
0.13 = US$358m ÷ (US$3.5b - US$823m) (Based on the trailing twelve months to June 2019.)
Therefore, Hunter Douglas has an ROCE of 13%.
View our latest analysis for Hunter Douglas
Is Hunter Douglas's ROCE Good?
ROCE can be useful when making comparisons, such as between similar companies. We can see Hunter Douglas's ROCE is around the 12% average reported by the Consumer Durables industry. Separate from Hunter Douglas's performance relative to its industry, its ROCE in absolute terms looks satisfactory, and it may be worth researching in more depth.
You can see in the image below how Hunter Douglas's ROCE compares to its industry. Click to see more on past growth.
When considering this metric, keep in mind that it is backwards looking, and not necessarily predictive. ROCE can be deceptive for cyclical businesses, as returns can look incredible in boom times, and terribly low in downturns. This is because ROCE only looks at one year, instead of considering returns across a whole cycle. How cyclical is Hunter Douglas? You can see for yourself by looking at this free graph of past earnings, revenue and cash flow.
What Are Current Liabilities, And How Do They Affect Hunter Douglas's ROCE?
Short term (or current) liabilities, are things like supplier invoices, overdrafts, or tax bills that need to be paid within 12 months. The ROCE equation subtracts current liabilities from capital employed, so a company with a lot of current liabilities appears to have less capital employed, and a higher ROCE than otherwise. To counteract this, we check if a company has high current liabilities, relative to its total assets.
Hunter Douglas has total liabilities of US$823m and total assets of US$3.5b. As a result, its current liabilities are equal to approximately 23% of its total assets. A fairly low level of current liabilities is not influencing the ROCE too much.
The Bottom Line On Hunter Douglas's ROCE
With that in mind, Hunter Douglas's ROCE appears pretty good. Hunter Douglas looks strong on this analysis, but there are plenty of other companies that could be a good opportunity . Here is a free list of companies growing earnings rapidly.
If you like to buy stocks alongside management, then you might just love this free list of companies. (Hint: insiders have been buying them).
We aim to bring you long-term focused research analysis driven by fundamental data. Note that our analysis may not factor in the latest price-sensitive company announcements or qualitative material.
If you spot an error that warrants correction, please contact the editor at editorial-team@simplywallst.com. This article by Simply Wall St is general in nature. It does not constitute a recommendation to buy or sell any stock, and does not take account of your objectives, or your financial situation. Simply Wall St has no position in the stocks mentioned. Thank you for reading.
