
 Yahoo Finance
 We Think Nisun International Enterprise Development Group (NASDAQ:NISN) Might Have The DNA Of A Multi-Bagger
To find a multi-bagger stock, what are the underlying trends we should look for in a business? Typically, we'll want to notice a trend of growing return on capital employed (ROCE) and alongside that, an expanding base of capital employed. This shows us that it's a compounding machine, able to continually reinvest its earnings back into the business and generate higher returns. Speaking of which, we noticed some great changes in Nisun International Enterprise Development Group's (NASDAQ:NISN) returns on capital, so let's have a look.
Understanding Return On Capital Employed (ROCE)
Just to clarify if you're unsure, ROCE is a metric for evaluating how much pre-tax income (in percentage terms) a company earns on the capital invested in its business. To calculate this metric for Nisun International Enterprise Development Group, this is the formula:
Return on Capital Employed = Earnings Before Interest and Tax (EBIT) ÷ (Total Assets - Current Liabilities)
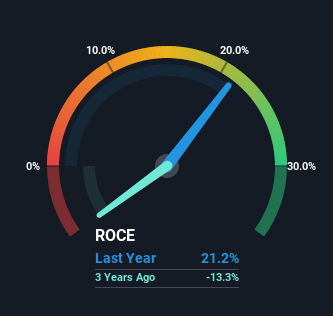
0.21 = US$41m ÷ (US$250m - US$55m) (Based on the trailing twelve months to June 2022).
Thus, Nisun International Enterprise Development Group has an ROCE of 21%. In absolute terms that's a great return and it's even better than the Software industry average of 10%.
View our latest analysis for Nisun International Enterprise Development Group
Above you can see how the current ROCE for Nisun International Enterprise Development Group compares to its prior returns on capital, but there's only so much you can tell from the past. If you're interested, you can view the analysts predictions in our free report on analyst forecasts for the company.
What The Trend Of ROCE Can Tell Us
Investors would be pleased with what's happening at Nisun International Enterprise Development Group. The data shows that returns on capital have increased substantially over the last five years to 21%. The company is effectively making more money per dollar of capital used, and it's worth noting that the amount of capital has increased too, by 510%. So we're very much inspired by what we're seeing at Nisun International Enterprise Development Group thanks to its ability to profitably reinvest capital.
One more thing to note, Nisun International Enterprise Development Group has decreased current liabilities to 22% of total assets over this period, which effectively reduces the amount of funding from suppliers or short-term creditors. So shareholders would be pleased that the growth in returns has mostly come from underlying business performance.
In Conclusion...
A company that is growing its returns on capital and can consistently reinvest in itself is a highly sought after trait, and that's what Nisun International Enterprise Development Group has. Although the company may be facing some issues elsewhere since the stock has plunged 73% in the last five years. In any case, we believe the economic trends of this company are positive and looking into the stock further could prove rewarding.
One final note, you should learn about the 5 warning signs we've spotted with Nisun International Enterprise Development Group (including 1 which is a bit unpleasant) .
If you'd like to see other companies earning high returns, check out our free list of companies earning high returns with solid balance sheets here.
Have feedback on this article? Concerned about the content? Get in touch with us directly. Alternatively, email editorial-team (at) simplywallst.com.
This article by Simply Wall St is general in nature. We provide commentary based on historical data and analyst forecasts only using an unbiased methodology and our articles are not intended to be financial advice. It does not constitute a recommendation to buy or sell any stock, and does not take account of your objectives, or your financial situation. We aim to bring you long-term focused analysis driven by fundamental data. Note that our analysis may not factor in the latest price-sensitive company announcements or qualitative material. Simply Wall St has no position in any stocks mentioned.
Join A Paid User Research Session
You’ll receive a US$30 Amazon Gift card for 1 hour of your time while helping us build better investing tools for the individual investors like yourself. Sign up here
