
 Yahoo Finance
 We Think Orca Energy Group (CVE:ORC.B) Might Have The DNA Of A Multi-Bagger
Finding a business that has the potential to grow substantially is not easy, but it is possible if we look at a few key financial metrics. Ideally, a business will show two trends; firstly a growing return on capital employed (ROCE) and secondly, an increasing amount of capital employed. This shows us that it's a compounding machine, able to continually reinvest its earnings back into the business and generate higher returns. And in light of that, the trends we're seeing at Orca Energy Group's (CVE:ORC.B) look very promising so lets take a look.
What Is Return On Capital Employed (ROCE)?
Just to clarify if you're unsure, ROCE is a metric for evaluating how much pre-tax income (in percentage terms) a company earns on the capital invested in its business. Analysts use this formula to calculate it for Orca Energy Group:
Return on Capital Employed = Earnings Before Interest and Tax (EBIT) ÷ (Total Assets - Current Liabilities)
0.32 = US$50m ÷ (US$220m - US$64m) (Based on the trailing twelve months to September 2023).
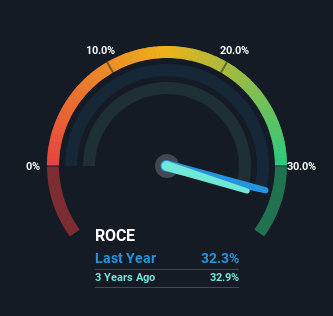
So, Orca Energy Group has an ROCE of 32%. In absolute terms that's a great return and it's even better than the Oil and Gas industry average of 9.9%.
See our latest analysis for Orca Energy Group
Above you can see how the current ROCE for Orca Energy Group compares to its prior returns on capital, but there's only so much you can tell from the past. If you'd like, you can check out the forecasts from the analysts covering Orca Energy Group here for free.
What The Trend Of ROCE Can Tell Us
Orca Energy Group has not disappointed in regards to ROCE growth. The data shows that returns on capital have increased by 405% over the trailing five years. The company is now earning US$0.3 per dollar of capital employed. Interestingly, the business may be becoming more efficient because it's applying 21% less capital than it was five years ago. Orca Energy Group may be selling some assets so it's worth investigating if the business has plans for future investments to increase returns further still.
The Bottom Line On Orca Energy Group's ROCE
In the end, Orca Energy Group has proven it's capital allocation skills are good with those higher returns from less amount of capital. Since the stock has only returned 19% to shareholders over the last five years, the promising fundamentals may not be recognized yet by investors. Given that, we'd look further into this stock in case it has more traits that could make it multiply in the long term.
On a final note, we've found 2 warning signs for Orca Energy Group that we think you should be aware of.
If you want to search for more stocks that have been earning high returns, check out this free list of stocks with solid balance sheets that are also earning high returns on equity.
Have feedback on this article? Concerned about the content? Get in touch with us directly. Alternatively, email editorial-team (at) simplywallst.com.
This article by Simply Wall St is general in nature. We provide commentary based on historical data and analyst forecasts only using an unbiased methodology and our articles are not intended to be financial advice. It does not constitute a recommendation to buy or sell any stock, and does not take account of your objectives, or your financial situation. We aim to bring you long-term focused analysis driven by fundamental data. Note that our analysis may not factor in the latest price-sensitive company announcements or qualitative material. Simply Wall St has no position in any stocks mentioned.
