
 Yahoo Finance
 What We Think Of Wacker Neuson SE’s (ETR:WAC) Investment Potential

Today we are going to look at Wacker Neuson SE (ETR:WAC) to see whether it might be an attractive investment prospect. To be precise, we'll consider its Return On Capital Employed (ROCE), as that will inform our view of the quality of the business.
First up, we'll look at what ROCE is and how we calculate it. Then we'll compare its ROCE to similar companies. And finally, we'll look at how its current liabilities are impacting its ROCE.
Understanding Return On Capital Employed (ROCE)
ROCE measures the 'return' (pre-tax profit) a company generates from capital employed in its business. In general, businesses with a higher ROCE are usually better quality. Ultimately, it is a useful but imperfect metric. Author Edwin Whiting says to be careful when comparing the ROCE of different businesses, since 'No two businesses are exactly alike.
How Do You Calculate Return On Capital Employed?
The formula for calculating the return on capital employed is:
Return on Capital Employed = Earnings Before Interest and Tax (EBIT) ÷ (Total Assets - Current Liabilities)
Or for Wacker Neuson:
0.086 = €151m ÷ (€2.3b - €500m) (Based on the trailing twelve months to September 2019.)
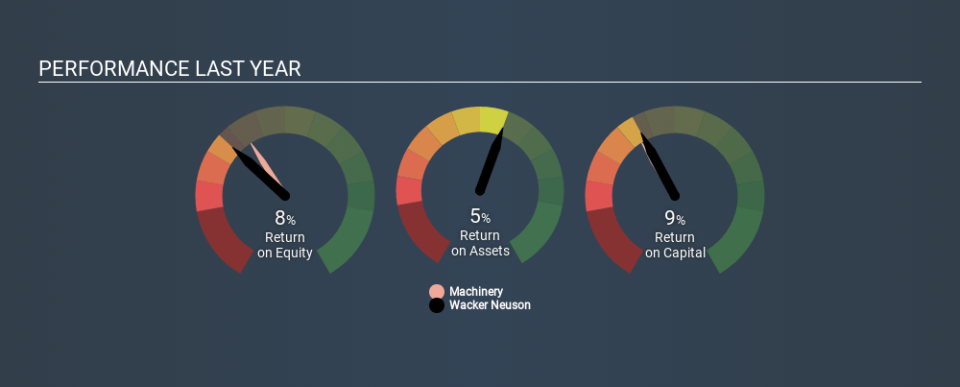
Therefore, Wacker Neuson has an ROCE of 8.6%.
View our latest analysis for Wacker Neuson
Is Wacker Neuson's ROCE Good?
ROCE is commonly used for comparing the performance of similar businesses. We can see Wacker Neuson's ROCE is around the 9.3% average reported by the Machinery industry. Regardless of where Wacker Neuson sits next to its industry, its ROCE in absolute terms appears satisfactory, and this company could be worth a closer look.
You can see in the image below how Wacker Neuson's ROCE compares to its industry. Click to see more on past growth.
When considering ROCE, bear in mind that it reflects the past and does not necessarily predict the future. ROCE can be deceptive for cyclical businesses, as returns can look incredible in boom times, and terribly low in downturns. This is because ROCE only looks at one year, instead of considering returns across a whole cycle. Future performance is what matters, and you can see analyst predictions in our free report on analyst forecasts for the company.
How Wacker Neuson's Current Liabilities Impact Its ROCE
Current liabilities are short term bills and invoices that need to be paid in 12 months or less. Due to the way the ROCE equation works, having large bills due in the near term can make it look as though a company has less capital employed, and thus a higher ROCE than usual. To check the impact of this, we calculate if a company has high current liabilities relative to its total assets.
Wacker Neuson has current liabilities of €500m and total assets of €2.3b. As a result, its current liabilities are equal to approximately 22% of its total assets. A fairly low level of current liabilities is not influencing the ROCE too much.
Our Take On Wacker Neuson's ROCE
With that in mind, Wacker Neuson's ROCE appears pretty good. There might be better investments than Wacker Neuson out there, but you will have to work hard to find them . These promising businesses with rapidly growing earnings might be right up your alley.
I will like Wacker Neuson better if I see some big insider buys. While we wait, check out this free list of growing companies with considerable, recent, insider buying.
If you spot an error that warrants correction, please contact the editor at editorial-team@simplywallst.com. This article by Simply Wall St is general in nature. It does not constitute a recommendation to buy or sell any stock, and does not take account of your objectives, or your financial situation. Simply Wall St has no position in the stocks mentioned.
We aim to bring you long-term focused research analysis driven by fundamental data. Note that our analysis may not factor in the latest price-sensitive company announcements or qualitative material. Thank you for reading.
